


Information and contacts for the Photo Documentation are from the following scientists, scientific papers and symposia.
I am deeply grateful to the individuals and organizations
mentioned below. However, all errors in fact, omission and inference in
this Web site are mine alone. I will gladly address each error brought
to my attention. Many of the individual scientists have papers specific
to their specialties that may or may not be referenced in the larger review
papers mentioned here.
1. Warming Winds: Atmospheric Science
Individuals providing general information or contacts
Dr. Bruce Peterson, Ecosystems Center, Marine Biological Laboratory, Woods Hole, MA, graciously provided an initial briefing on climate change as I began my project. In October 2002 he again briefed me, on changes in freshwater flow into the Arctic.
Dr. Malcolm Hughes, Professor of Dendrochronology, Laboratory of Tree-Ring Research, University of Arizona, allowed me to accompany him and his team taking tree-ring cores from down wood and snags of Bristlecone pine. He also informed my project with his long-term view of climate change. He is co-author of the 1000-year atmospheric temperature graph (see below), with Michael Mann and Raymond Bradley.
Dr. Kevin E. Trenberth, Climate Analysis Section,National
Center for Atmospheric Research, Boulder CO. Provided some of the graphs
shown on these pages and references for others.
Dean James Gustave Speth, Department of Environment and Forestry, Yale University, New Haven CT. Invited me to speak at a climate symposium in Washington DC at which I met many scientists.
Dr. Walt Oechel, Global Change Research Group, Dept of Biology, San Diego State University. Was kind enough to offer access to the atmospheric gas flux study sites at Barrow, Alaska, in August 2002. He also outlined his long-time study of carbon sinks, sources and Net Ecosystem Exchange.
General climate science references
Donald Kennedy, Editor-in-Chief of the journal Science, on US climate policy: "The current climate change policy depends entirely on voluntary reduction targets,which even if met, would allow US emission rates to continue to grow at around 14% per decade. ... The failure to act promptly on climate change carries heavy prospective penalties. ... A growing body of evidence disfavors [the] "slow ramp" hypothesis of global warming, with its emphasis on gradual change followed by societal adaptation to the altered climate regime. Instead, it now appears equally likely that warming events will trigger an abrupt nonlinear process, producing dramatic regional temperature decreases, especially in the temperate Northern Hemisphere." Science 299 (12 March 2003) pg 1813
An overview of climate science and change that was particularly helpful to me is "Increasing Carbon Dioxide and Global Climate Change" by Michael C. MacCracken, Lawrence Livermore National Laboratory (retired). Updated from "Global Warming: A Science Overview" in Global Warming and Energy Policy (Kluwer Academic/Plenum Publishers, New York, 2001) pg 151-159 MacCracken writes: "By looking at such factors and the history of emissions versus concentrations, analyses of carbon isotopes, tree rings, and other scientific measures, it is clear that human activities have causes the increase from the preindustrial level that has persisted since the end of the last glacial. "Taken together, these results indicate the the current CO2 concentration of about 370 parts per million by volume (ppmv) is about 30% above its preindustrial level of about 280 ppmv and that the present value has not been exceeded back through at least the past few glacial cycles (and likely as far back as several million years or more). The analyses also indicate that the increase in the CO2 concentration since the mid 19th C has been due primarily to the combustion of fossil fuels and secondarily to the release of carbon occurring in the clearing of forested land and the plowing of soil for agriculture." (page 3)
J. R. Petit, et al, "Climate and atmospheric history of the past 420,000 years from the Vostok ice core, Antarctica" in Nature 399, pg 429 (3 June 1999).
"Atmospheric concentrations of carbon dioxide
and methane correlate well with Antarctic air-temperature throughout
the record. Present-day atmospheric burdens of these two important greenhouse
gases seem to have been unprecedented during the past 420,000 years."
Other studies also show that over long time scales CO2 levels are highly
correlated with temperature.
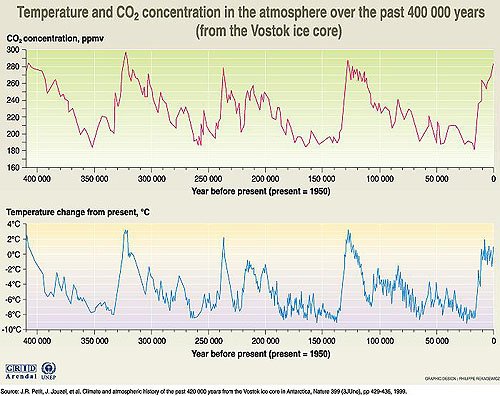
This graph and others used by permission of GRID-Arendal, the graphics arm of the UN Environmental Programme. It is an excellent source of illustrations and charts on environmental subjects of many kinds. http://www.grida.no
Falkowski et al. in Science vol 290 pg
291 (13 October 2000).
"We have left the domain that defined the earth system for the 420,000 years before the Industrial Revolution. Atmospheric CO2 concentration is now nearly 100 ppmv higher and has risen to that level at a rate at least 10 and possibly 100 times faster that at any other time in the past 420,000 years."
Predictions of coming temperature increases are based on computer models, which variously do mimic past climate, calibrated to show what will happen with a doubling of 1880 CO2 levels. That level is around 280 ppm so double is 560 ppm. Current level is approximately 370 ppm. A study by Pearson and Palmer in Nature 406 pg 695 (17 August 2000) indicates CO2 concentrations have been generally below 500 ppm for 24 million years.
This is Charles Keeling's famous chart of CO2
measured in Hawaii. He started a worldwide sampling of air for CO2, every
location of which shows this increasingly steep curve. The figure at the
end of 2002 was just above 370 ppm. This is probably the highest
concentration of carbon dioxide in at least 400,000 years (see Vostok
measurements below) and correlates with the steep rise in earth
temperatures during the same period. The yearly cycles indicate
the decrease in C02 each spring when Northern Hemisphere plants begin
their growth cycle.
Susan E. Page, et al in Nature Vol 420
pg 61 (7 Nov 2002).
The burning of peat forests in Indonesia in 1997, partly an effect of
El Nino, resulted in the "largest annual increase in atmospheric
CO2 concentration detected since records began in 1957"
Sandalow and Bowles in Science 292
pg 1839 (8 June 2001).
The American contribution of carbon to the atmosphere
averaged 5.5 tons per person in 1999. This is more than double that
of Russia, double the EU, double Japan. China emits about 1/2 ton per
person.
Richard Alley, "Ice-core evidence of abrupt
climate changes" in Proc National Academy of Sciences 97:4 page 1331
(15 Feb 2000).
A review of Greenland ice core science, in which he
describes some of the abrupt changes shown in the core record, as the
Earth emerged from the last glaciation. The temperature rose as much
as 8 degrees C in about 10 years. Also see Alley et al, "Abrupt
Climate Change: Inevitable Surprises" published Dec 11 2001 by
the National Academy of Sciences National Research Council see: http://www.nap.edu/openbook/
The 2000 year temperature record on Home Page and Paleoclimate,
is by Michael E. Mann of the University of Virginia, Charlottesville
VA, and Philip D. Jones, of the Climatic Research Unit, University
of East Anglia, UK. The paper is "Global
Surface Temperatures over the Past Two Millennia," Geophysical
Research Letters, Vol. 30, No. 15, pg 1820 (August 2003). For more information,
please see http://www.ngdc.noaa.gov/paleo/pubs/mann2003b/mann2003b.html
Earlier, a 1000 year temperature
reconstruction was published by Mann with Raymond Bradley and
Malcolm Hughes, "Northern Hemisphere Temperatures During the
Past Millennium: Inferences, Uncertainties, and Limitations" American
Geophysical Union, Geophysical Research Letters, Vol. 26, No. 6, p.759
(1999).
Some other background studies on millennial and long-scale
climate records:
Bradley, R.S., 1999: Paleoclimatology:
reconstructing climates of the Quaternary. Harcourt/Academic Press, San
Diego, 610pp.
Bradley, R.S. and Jones, P.D., 1993: 'Little
Ice Age' summer temperature variations: their nature and relevance to
recent global warming trends. The Holocene 3, 367-376.
Briffa, K.R.., 2000: Annual
climate variability in the Holocene; interpreting the message of ancient
trees. Quaternary Science 19, 87-105.
Crowley, T.J., 2000 Causes
of climate change over the past 1,000 years. Science 289, 270 .
(compiled by Climatic Research Unit. cru@uea.ac.uk Reprinted
with credit as required.)
Also see the new Paleoclimate section of
this Web site.
* Data collected from weather and climate stations, satellites, ships,
buoys and floats indicate that the 2003 average global temperature ranked
as second warmest on record, tied with 2002 but cooler than the record
warm year of 1998. The 10 warmest years have all occurred since 1990.
http://www.ncdc.noaa.gov/oa/climate/research/2003/ann/ann03.html
The graph of recent earth mean surface temperature shown on my home page
charts the irregular but steep rise since the generally accepted time
in the Industrial Revolution when fossil fuel became broadly available.
Unlike the long scale paleorecord above, this is based on actual thermometer
readings. This graph represents a comparison with the "normal"
mean temperature during 1961-1990, in terms of degrees of deviation
from it.
"The time series shows the combined global land
and marine surface temperature record from 1856 to 2001. On this graph,
the year 2001 was the second warmest on record (now supplanted by
the much warmer 2002). 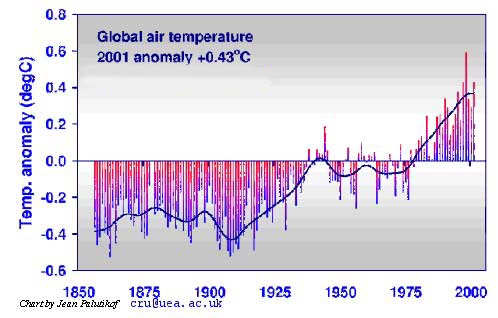
This time series is being compiled jointly by the Climatic Research Unit and the UK Met. Office Hadley Centre. The record is being continually up-dated and improved. The principal reason is to detect climate change due to global warming through an increase in temperature in the instrumental record. Increased concentrations of greenhouse gases in the atmosphere due to human activities are most likely the underlying cause of warming in the 20th century."
Created by Jean Palutikof of the Climate Research Unit
in the UK and is reprinted with credit as required. Please see http://www.cru.uea.ac.uk/cru/info/warming/
created by Jean Palutikof of the Climate Research Unit in the UK and is
reprinted with credit as required
http://www.cru.uea.ac.uk/cru/info/warming/
The key reference for this time series is:
Jones, P.D., New, M., Parker, D.E., Martin, S. and
Rigor, I.G., 1999:
Surface air temperature and its changes over the past 150 years.
Reviews of Geophysics, 37, 173-199.
"The 1990s were the warmest decade in the series. The warmest
two years of the entire series were 2001 and 1998, with the latter the
warmest at 0.59°C above the 1961-90 mean. The eight warmest years
globally have now occurred in the 1990s and 2000s. They are, in descending
order, 1998, 2001, 1997, 1995, 1990 & 1999, 1991 & 2000
"
cru@uea.ac.uk Reprinted with credit as required.
Simon Tett, P. Stott, M. Allen, W. Ingram and J. Mitchell, "Causes of twentieth-century temperature change near Earth's surface" in Nature 399 Pg 569 (10 June 1999)
"For the warming from 1946 to 1996 regardless of any possible amplification of solar or volcanic influence, we exclude purely natural forcing, and attribute it largely to the anthropogenic components."
Most studies of this century agree that at least the most recent steep increase in temperature can only have come about due human-caused greenhouse gases. However, other cycles are being detected and there seems to be much more to be learned about how various natural changes interact with human caused temperature increases.
Height of last ice age "Last Glacial Maximum" was about 20,000 years ago. This is a benchmark in climate that is used often to date changes since then. Global average temperature then was 5° to 9° C cooler than now. The current IPCC estimate of temperature rise in the next 100 years is 1.4° to 5.8° C.
Dr. Walt Oechel's study at Barrow, "Patterns
and controls of temporal variation in CO2 sequestration and loss in arctic
ecosystems" is documented at http://www.sci.sdsu.edu/GCRG/
Also see:
Oechel et al, Acclimation of ecosystem CO2 exchange in the Alaskan
Arctic in response to decadal climate warming. Nature, 406 pg 978 (2000).
For information about the CO2 monitoring at Barrow and other places, see
the Web site of the Climate Monitoring & Diagnostics Laboratory of NOAA. This site also includes data on the 1.40C mean annual
temperature rise at Barrow over thirty years, and the trend toward earlier
snowmelt date. http://www.cmdl.noaa.gov/star/
Ramzi Touchan, Research Specialist, Tree-Ring Laboratory, University
of Arizona, Tucson, provided more background information about dendrochronology,
and access to research samples to photograph.
See "Paleo Perspective on Global Warming" http://ngdc.noaa.gov/paleo/globalwarming/
for more information about computing and studying historical earth temperatures.
David A. King, Chief Scientific Advisor to the British Government, Office of Science and Technology. In article "Climate Change Science: Adapt, Mitigate, or Ignore?" Science 303 9 Jan 2004 pg 176. Remarks were largely repeated at a plenary address to the 2004 meeting of the AAAS Seattle WA Feb 13, 2004. "In my view, climate change is the most severe problem that we are facing today -- more serious even than the threat of terrorism." He also said, "We are already in in the period of global warming, and we can already assess the damage that global warming is causing and an assessment of the number of people who are dying prematurely around the world as as side effect of climate change, that is extreme events occurring more often than they would otherwise have occurred, is around 160,000." (transcript of Seattle speech, page 5; also was on a slide shown at same time)
![]()
COPYRIGHT NOTICE:
Photography and text Copyright © 2005 - 2017 (and before) Gary Braasch All rights reserved. Use of photographs in any manner without permission is prohibited by US copyright law. Photography is available for license to publications and other uses. Please contact requestinformation@worldviewofglobalwarming.org. View more of Gary Braasch's photography here.