

Mauna Loa -- Carbon Dioxide levels reach 400 ppm, a danger sign to scientists
Global concentration of CO2 in the air -- the primary cause of global warming -- has been increasing in recent years at record amounts, and it has now reached a level unprecedented in more than two million years. In March 2015, for the first time the average of all of NOAA's 40 CO2 measuring sites showed a concentration above 400 parts per million (ppm). This follows the individual observatory high points of 400 ppm in the spring of 2012 at the Barrow, Alaska, observatory, and the April 2013 high of 400 as measured by the Scripps Institution of Oceanography and NOAA on the upper flanks of the Mauna Loa volcano, Hawaii. In 2015 Mauna Loa is running consistently above 400 ppm month after month.
This is a concentration never before reached in modern measurements. It is measurably the highest concentration of CO2 for more than 800,000 years and probably the highest in several million years. Levels in the atmosphere result from natural and human emissions, but human emissions far exceed natural ones, such as from volcanoes. The concentration in the air varies through the year, because the oceans and the earth's plant life absorb carbon dioxide at varying rates. CO2 is responsible for 63 percent of the warming attributable to all greenhouse gases, and many scientists have recommended the world should act to keep the CO2 levels below 400-450 ppm in order to prevent even more irreversible and disastrous climate change effects.
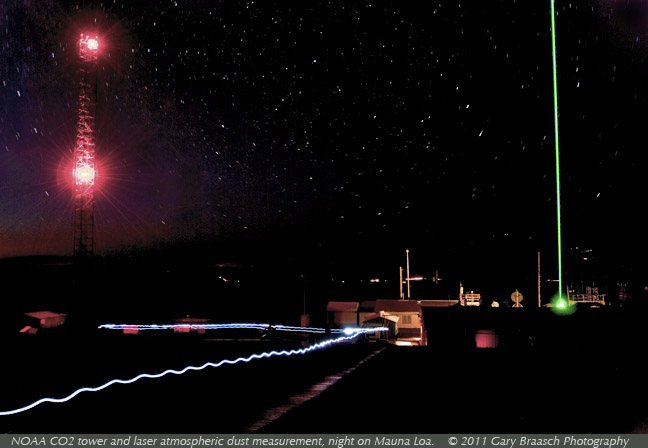
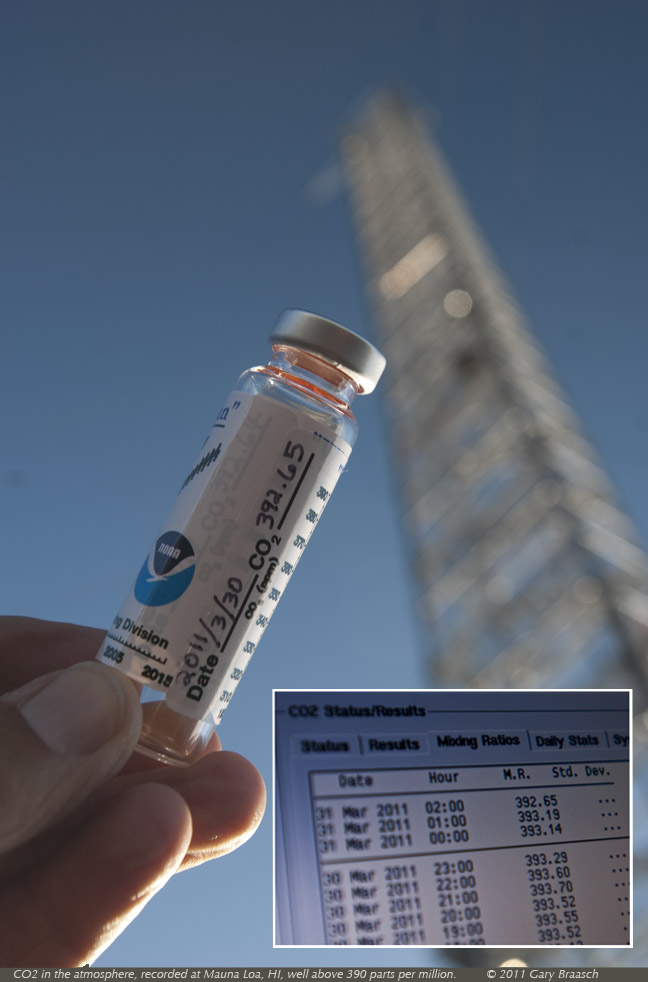
Global emissions of carbon dioxide from the combustion of fossil fuels were 36 billion tonnes for the year 2013. "This is a level unprecedented in human history," says Dr Pep Canadell, Executive-Director of the Global Carbon Project (GCP). Here on Mauna Loa, air is collected on a 40 meter (130 foot) tower (left) and analyzed for CO2 content. At right, a powerful laser beam is used to measure aerosols and particles in the air up to 45 km into the stratosphere. Average yearly CO2 concentrations here have risen from 315.98 parts per million (ppm) in 1959 to more than 398 in 2013 and now over 400 ppm so far in 2014. NOAA's Carbon Dioxide Information Analysis Center (CDIAC) reported that the average CO2 concentration at Mauna Loa increased by more than 2 percent in 2012 and 2013. Last year human activities spewed about 36 million metric tonnes of CO2 into the air -- a record amount -- even though direct U.S. emissions are slightly decreasing.
When Gary Braasch photographed the Mauna Loa NOAA observatory in late March 2011, the CO2 concentration was measured at more than 392 parts per million (ppm) -- nearly 3 ppm higher than in December 2010 and 112 ppm (40 percent) higher than the level that prevailed before the Industrial Revolution (approx 280 ppm). The burning of fossil fuels which began around 1750 and is considered the largest measured source of the added CO2, continues unabated worldwide. Scientists are very certain from thousands of studies and observations that this greenhouse gas, with contributions from methane and several other gases, warms the atmosphere increasingly as atmospheric concentrations go up ever higher. Analysis of our world's average surface temperatures by NASA and NOAA confirms that the Earth is warming: 2010 was the warmest year ever measured since the 1880s, slightly warmer than 2005, and 1.13°F warmer than the mid-20th century average.
Given the huge volume of the Earth's atmosphere, the very slow pace of previous times of warming (like at the end of the last ice age) and the changes already seen due to warming over just the past several decades – scientists say the current greenhouse gas and temperature rise is unusual and very rapid. NOAA said that today’s rate of increase due to the world's intense dependence on burning fossil fuels is more than 100 times faster than happened naturally at the end of the last ice age. Prehistoric levels of CO2 probably have not exceeded 400 ppm for 2 to 3 million years, a time in the middle of a very long term natural decrease from higher levels that existed in the age of the dinosaurs. Past CO2 can be directly measured in bubbles in polar ice cap cores back to 800,000 years ago and estimated from sediments in Arctic lakes as far back as 5 million years. The air temperature several million years ago when CO2 was around 400 ppm was up to 8 degrees C (14 degrees F) higher than today, according to studies recently published by Dr. Julie Brigham-Grette of University of Massachusetts and her colleagues.
We are already on a continuum of climate change effects: glaciers are melting, sea level is rising, habitats are moving, species are being pushed toward extinction and millions of people are caught in severe weather events. Scientists advising the United Nations recommend the world should act to keep the CO2 levels below 400-450 ppm in order to prevent even more irreversible and disastrous climate change effects.
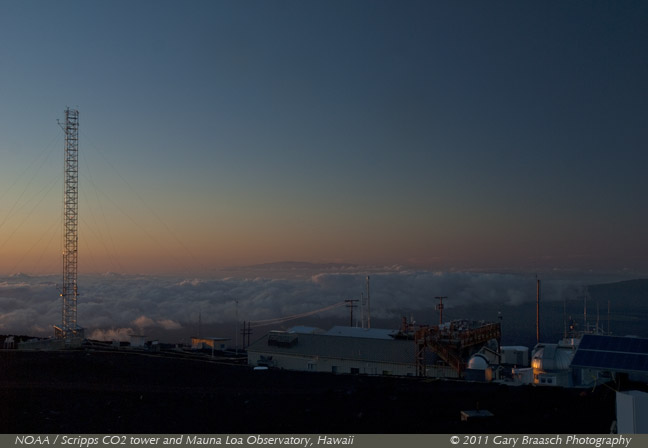
Overview of NOAA's atmospheric and space observatory, at 3400 meters on the northeast flank of Mauna Loa volcano in Hawaii. The observatory consists of 10 buildings from which up to 250 different atmospheric parameters are measured. Measuring carbon dioxide at this location begun in 1958 at the request of Charles David Keeling of Scripps Oceanographic Institution, has created the longest continuous record of atmospheric CO2 concentrations available in the world. The resulting "Keeling Curve" showing the yearly seasonal fluctuation in CO2 and the rising rate of increase year to year has become central to the understanding of global warming. Average yearly CO2 concentrations here have risen from 315.98 parts per million (ppm) in 1959 to 393.8 -- an average growth rate of more than 1.4 ppm per year. But in recent years measurements from Mauna Loa and other observatories have been rising much faster rate of up to 2.76 ppm per year.
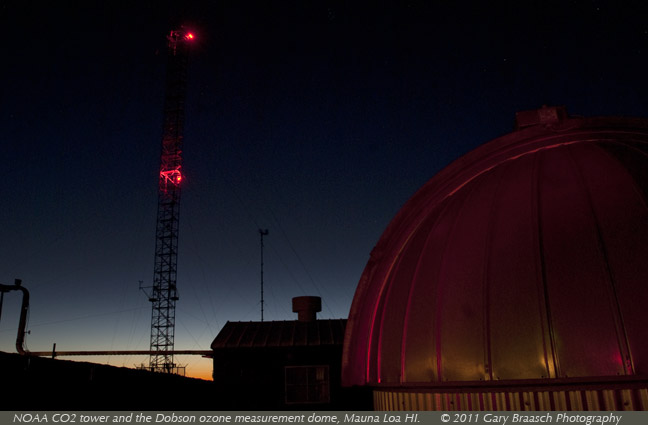
Air is collected continuously near the top of a 40 m tower (and several shorter towers), and analyzed for CO2 content every minute by both Scripps Oceanographic Institute and NOAA. The accuracy of readings is tested by periodically measuring known quantities of CO2 kept in standard reference tanks in the lab. Results are computed hourly by NOAA. Worldwide coverage and comparison is insured by similar measurements at three other major observatories and hundreds of ground, airborne, balloon and tower CO2 measurements. Equipment in the nearby dome in this photo measures the thickness of the ozone layer -- a crucial protection from ultraviolet radiation and subject of a successful international agreement to limit chemicals which deplete the ozone. This agreement, the Montreal Protocol, is one model of international cooperation for the general good which influences the negotiations over the UN Framework Convention on Climate Change.
When Gary Braasch photographed the Mauna Loa NOAA observatory in late March 2011, the CO2 concentration was measured at more than 392 parts per million (ppm) -- nearly 3 ppm higher than in December 2010 and 112 ppm (40 percent) higher than the level that prevailed before the Industrial Revolution (approx 280 ppm). The burning of fossil fuels which began around 1750 and is considered the largest measured source of the added CO2, continues unabated worldwide. Scientists are very certain from thousands of studies and observations that this greenhouse gas, with contributions from methane and several other gases, warms the atmosphere increasingly as atmospheric concentrations go up ever higher. Analysis of our world's average surface temperatures by NASA and NOAA confirms that the Earth is warming: 2010 was the warmest year ever measured since the 1880s, slightly warmer than 2005, and 1.13°F warmer than the mid-20th century average. Given the huge volume of the Earth's atmosphere, the very slow pace of previous times of warming (like at the end of the last ice age) and the changes already seen due to warming over just the past several decades – scientists say the current temperature rise is unusual and very rapid. See Earth Under Fire: How Global Warming is Changing the World for details.
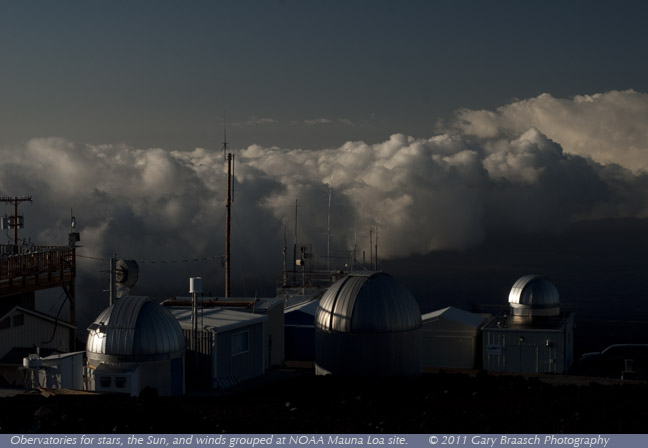
A line-up of observatories above the clouds on Mauna Loa, Hawaii. From left to right: University of Hawaii VYSOS project aims at surveying all the major star forming regions for variable young stars; Solar Dome continues NOAA's measurement of the transmission of sunlight, the longest continuous record of this nature in existence; and the University of Hawaii GroundWinds instrument tests wind-measuring equipment that might later be deployed on a satellite.
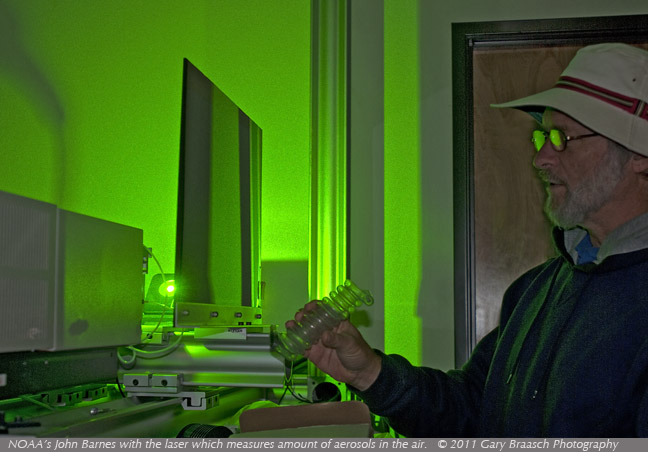
Dr. John Barnes, NOAA's Mauna Loa Observatory Station Chief, in the laser radar room of the station. He is principal investigator for long term monitoring of stratospheric aerosols made up of sulfuric acid and water which cool the earth by reflecting the sun's light back into space, affecting solar radiation and ozone. Once each week Barnes aims a powerful pulsed laser into the stratosphere to light up tiny particles and create a high-resolution vertical profile of the optical scattering characteristics of aerosols, clouds, and the background molecular atmosphere. This technique is called LIDAR (Light Detection and Ranging) and measures back-scattered laser light from particles and molecules using four telescopes aimed at the laser beam at various heights above the station. These readings can be related to the total amount of stratospheric aerosols and the cooling they create. Dr. Barnes is holding a flash lamp used to pump the original Ruby laser which measured stratospheric aerosols from the early 1970's until 1998. The new, more powerful lidar started operation in 1994.
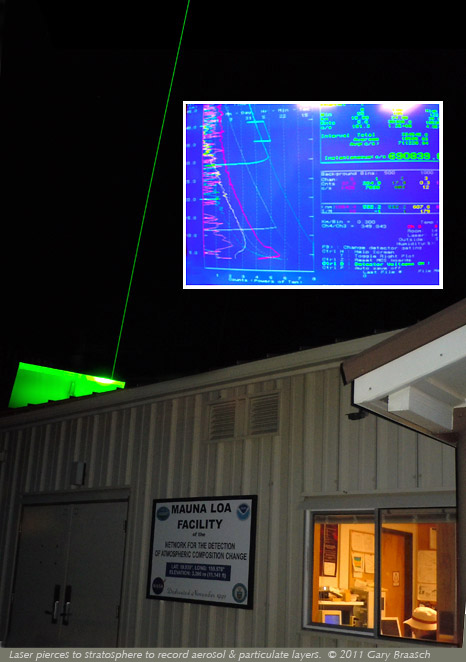
As the laser shoots a green beam of light into the stratosphere from a hatch in the roof of the station, John Barnes settles into his office for several hours of monitoring the LIDAR equipment and the read-outs on his computer screen. Traces created from back-scattered laser light detected by the four telescopes show particulates and aerosols at miles above the station. In addition to the primary target of stratospheric aerosols, which are about 99 percent sulfuric acid/water droplets created by volcanos, the LIDAR can also detect tropospheric aerosols. Barnes said that during this time of the year there are often dust storms in China and the lofted dust and pollution can be carried out over the Pacific. On the night these photos were made, March 31, 2011, one of these layers showed an elevated spike (red trace) at 5 km in the atmosphere above the observatory.
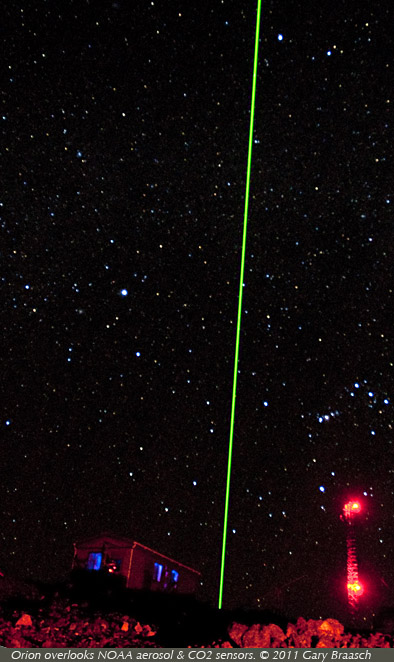
One of the clearest skies on the planet gives Mauna Loa observatory, at 3400 meters (more than 11,000 feet), a spectacular backdrop of stars for its measurements. Here, Orion overlooks the neighboring CO2 tower on the right and the stratospheric aerosol-detecting LIDAR laser beam. These two measurements are both related to the temperature of the atmosphere: While CO2 molecules warm the atmosphere, the aerosols in the stratosphere reflect sunlight away from the Earth, and heavy concentrations, such as from explosive volcanic eruptions can cool the earth. Mauna Loa records clearly show the effect of increased aerosols from the large eruptions of El Chichon(1982) and Mt Pinatubo (1991) and resulting decreased solar radiation for a few years afterwards. The Pinatubo eruption cooled the Earth by about one degree F. for more than a year. Today's atmosphere is comparatively low in stratospheric aerosols, according to NOAA's John Barnes, so there is little contribution to reduction in the rising greenhouse warming.
![]()
COPYRIGHT NOTICE:
Photography and text Copyright © 2005 - 2017 (and before) Gary Braasch All rights reserved. Use of photographs in any manner without permission is prohibited by US copyright law. Photography is available for license to publications and other uses. Please contact requestinformation@worldviewofglobalwarming.org. View more of Gary Braasch's photography here.