

GLOBAL WARMING AND CLIMATE CHANGE EXPLAINED
Global warming refers to an increase in the Earth’s average surface air temperature. Global warming and cooling in themselves are not necessarily bad, since the Earth has gone through cycles of temperature change many times in its 4.5 billion years. However, as used today, global warming usually means a fast, unnatural increase that is enough to cause the expected climate conditions to change rapidly and often cataclysmically.

Our planet is warmed by radiant energy from the sun that reaches the surface through the atmosphere. As the surface warms, heat energy reflects back toward space; meanwhile, gases in the atmosphere absorb some of this energy and reradiate it near the surface. This is often called the greenhouse effect, named for the way heat increases inside a glass enclosure. In the greenhouse effect around Earth, the atmosphere can be visualized as a blanket that is made thicker by the action of a small amount of water vapor, carbon dioxide, methane, ozone, nitrous oxide, other gases, and soot; it thus holds in more heat, forcing air temperature higher. The scientific term for this action is, in fact, “forcing.”
On an average day, this effect is caused by water vapor and clouds (75 percent) and carbon dioxide (20 percent), with the rest fthe heating caused by other gases. Relatively small additions of carbon dioxide and methane force more heat, and that heat allows the air to hold more water vapor, creating a feedback loop that magnifies the effect. Although water vapor is naturally prevalent in the atmosphere, it does not trap as much heat per molecule as carbon dioxide and methane. Also, water vapor molecules cycle through the atmosphere in only a few days, a brief period compared to the residence time of CO2,which persists for many decades and creates some warming even after as long as three hundred years. Dust and aerosol chemicals in the air cause some cooling (negative forcing); they are also very short lived. Even though the gases are measured only in parts per million (ppm) or billion (ppb), they have been powerfully, and naturally, influencing the Earth’s temperature for millions of years. Without them, instead of an average air temperature of about 58°F (14.5°C), the Earth would be below the freezing point. Life as we know it now would be impossible.
Earth’s temperature is also subject to natural forcing cycles from solar radiation and the movement of the planet around the sun. Scientists think these cycles, which have left a visible signature extending back millions of years, arewhat led to past iceages and the warming that ended them. Currently, we are in a period between major iceages. The last great glaciation, when temperatures were about 10°to 12°F (6°to7°C) cooler than today, began fading away about 18,000 yearsago. The initial transition out of the ice age was unstable,with many rapid temperature shifts. As temperatures warmed, climate was affected.
Climate is the accumulation of weather effects—wind, rainfall, heat, cold—experienced in a place over many years, an average of thousands of days’ worth of weather. Climate is what one expects in a certain place; weather is what occurs day by day. One result of global temperature increase or decrease is climate change, referring to a shift in not only average local temperature but also rain- and snowfall, cloudiness and storms, the seasons, and river flow, with associated impacts on the biosphere, the portion of the Earth and its atmosphere that supports life. Although in our daily lives we are attuned to day-by-day swings of temperature and weather, the long-term changes of climate and average Earth temperature are more difficult to apprehend.
During most of the more recent past (say, 10-11,000 years), the concentration of greenhouse gases remained relatively stable, and so did the Earth’s temperature and climate. This was the time when humans developed civilizations and learned how to build cities, grow food, and invent machines. It is possible that early farming and forest clearing had a warming effect on the Earth beginning five thousand to eight thousand years ago. There are also a few examples of natural temperature shifts, such as the Medieval Warm Period, which was followed by the Little Ice Age in the fifteenth through eighteenth centuries. These were possibly not global in extent, and there is scientific disagreement over their causes which seem to have included periods of solar radiation increase and decrease and volcanic eruptions.
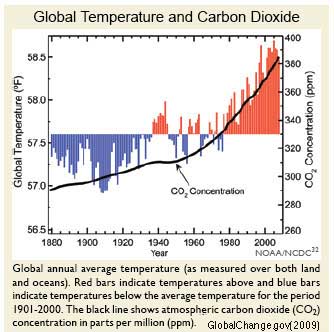
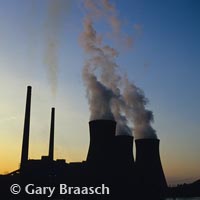
During the Industrial Revolution, people began to use coal and, later, petroleum, to heat cities and run machines. Carbon dioxide in the atmosphere, a by-product of burning both coal and oil, began to increase. Since then, levels of carbon dioxide have risen by almost 35 percent, methane concentrations (coming from ricefields, cattle, landfills, and leaks of natural gas) have more than doubled, and nitrous oxide concentrations (another by-product of oil) have gone up by about 15 percent. Some chemicals invented by humans, like chlorofluorocarbons, are also greenhouse gases. Increased greenhouse gases mean more heat is kept in the atmosphere, which led beginning in the late 1800s to arise in both ocean and air temperature. Between then and 1945, world temperature rose but then leveled off and even decreased a little through the 1960s. The best explanation for that dip appears to be the rise in industrial air pollution during and after the war years, including dust and sulfur, which, as aerosols, cool the atmosphere. Beginning in the 60s, laws mandated the reduction of aerosol pollution. The sun’s luminosity varied a little through these years, but this appears to have had only minor influence.
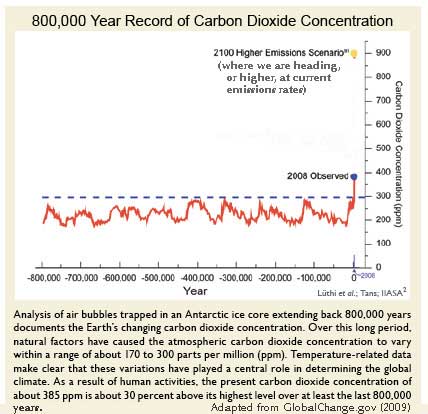
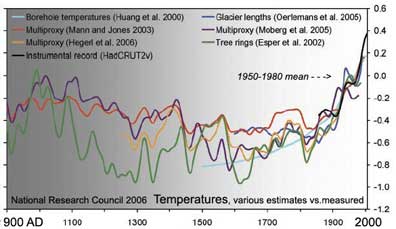
The recent increase in atmospheric CO2 is 200 times as great as any previous change known and the current level is 385 parts per million, the highest seen in 800,000 years of deep glacier ice core records. It shows no signs of decreasing. Since the 1970s atmospheric heat has been rapidly increasing. Whereas the average temperature of the planet rose about 1°F (0.6°C) between the mid-nineteenth century and the end of the twentieth, in the past twenty-five years alone the temperature has risen just over 0.8°F (0.5°C). (The last ice age would have ended in only four hundred years—instead of many thousands—at this rate of heating.) The total heating from the late nineteenth century to 2005 is 1.4°F (0.8°C). The ocean has actually absorbed most of the added CO2 and heat -- becoming warmer and very slightly more acidic. The only explanation that comports with data and observations of sun, atmosphere and ocean is the steep rise in greenhouse gases. This rise has been shown to be the result not of natural changes but of human activities ( "antropogenic"), primarily the burning of fossil fuels but also farming and forest clearing. Extensive urbanization, air pollution, forrest fires and increased pumping of water have caused regional change as well. Furthermore, scientists know the added carbon dioxide comes from our actions because this CO2 has an unmistakable chemical signature.
This research has created what has become the single most powerful icon of climate change, the so-called "hockey-stick" graph of temperatures. In 2005-6 it was subjected to intense re-analysis. Evidence of previous cool and warm periods has increased, but the rapid and sustained heat gain especially since the 1970s remains unparalleled in recent earth history. All this evidence, plus the vast range of changes to plants, animals, storms and glaciers which correlate strongly to the measured temperature rise, caused world climate scientists to declare in 2007 that "Warming of the climate system is unequivocal," and that there is more than a 90 percent assurance that "most of the observed increase in global average temperatures since the mid-20th century is ... due to the observed increase in anthropogenic greenhouse gas concentrations." (see below)
These increases have a giant effect on weather, climate zones, plants and animals, sea life, glaciers and river flow. In response, our planet has been changing with warming winds and rising seas. The 10 warmest years on record have all occurred since 1997, according to meteorologists. 2005 and 1998 were the warmest. At the poles and in mountains, ice is melting and glaciers are receding. Arctic sea ice reach the smallest summer extent ever recorded in the past few years. Even in Antarctica, where winter sea ice has been larger in extent recently, it melts back much more than before in the summers, affecting the food supply of whales and penguins. The planet has heavier downpours now but also deeper droughts. Down into the temperate zone, change is rearranging the boundaries of life. The plants and animals with whom we share the planet are adapting and moving -- some even going extinct -- because they have no choice.
We six billion humans are being affected, too. Coastal towns are suffering from rising sea level, storms are getting more intense and 35,000 people died in European heat waves in 2003. However, we have choices to make to help correct and ameliorate global warming. This is a story of frightening scale and and great urgency that is just beginning to be told.
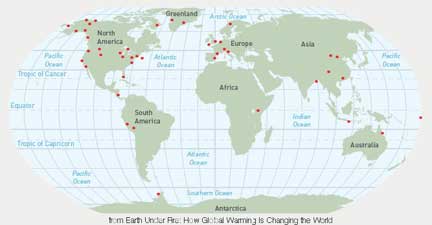
Locations documented by Gary Braasch in World View of Global Warming, 1999-2010
For more on past climate and today's weather, see the Paleoclimate and Weather sections.
Report on the latest United Nations scientific report, the 2007 Intergovernmental Panel on Climate Change
The world's climate scientists reported unequivocally in 2007 that the Earth's climate system is increasingly heating up and that it likely has not been this warm for at least 1300 years. The fourth report of the UN's Intergovernmental Panel on Climate Change (IPCC) says that evidence for this includes more than increases in global average air and ocean temperatures.
As has been reported on this site, heating effects are strong in melting of snow and ice, rising global mean sea level, widespread changes in precipitation amounts, ocean salinity, wind patterns and aspects of extreme weather including droughts, heavy precipitation, heat waves and the intensity of tropical cyclones. With much stronger language and more assurance than in previous reports, the IPCC members said there was less than 10 percent chance that this global warming was natural -- they pinned it directly on human greenhouse gas emissions. The amount of CO2 spewed out per year from fossil fuel burning is 12 percent greater now than in the 1990s, their report indicated, and the amount of the greenhouse effect is the greatest in 10,000 years.

The forecast range of possible temperatures by the end of the century reaches higher in this report than did the previous one in 2001 --11.5 degrees F -- but the more probable range is between 3.2 and 7 degrees F. The rate of rise depends on if and how fast emissions are reduced and on possible adverse feedbacks in the climate system. All probable temperatures are far beyond the increase in the 20th C and will take modern civilization into uncharted territory. Temperatures are sure to rise faster in the next decades, the IPCC said, than they did during the same time span in the last half of the 20th century.

Even now, the scientists reported, the last time the Arctic was significantly warmer was about 125,000 years ago, before the last ice age. At that time, sea level rose 4 to 6 meters as polar ice melted. For this coming century the IPCC is forecasting sea level to rise from 7 inches to about half a meter, depending on emissions and warming. The scientists expressed uncertainty about rapid melting of the Greenland ice cap, citing a lack of enough research so far; this is sure to be one of the more controversial parts of the report since some glaciologists think Greenland and possibly Western Antarctica glacier melt will add considerably more to sea level.
Scientists said "it is very likely that hot extremes, heat waves, and heavy precipitation events will continue to become more frequent," that it was very certain that the ocean would become more acid from taking up more CO2 and that the great currents in the North Atlantic were likely to slow but not stop.
If CO2 emissions can be reduced far enough, the report estimated, the atmosphere could be stabilized at a much lower level of greenhouse effect than is forecast now. Still, the effects of global warming will be with us for many centuries, the IPCC said, because of the inertia of the atmosphere and oceans and the 100 + year persistence of greenhouse gases.
The significance of this report is less its absolute numbers, than in the strength of its judgements and its acceptance, in the UN's consensus procedure, by the world's nations including the U.S. and China. The IPCC also reported on changes to the natural world, and on mitigation and adaptation strategies to reduce the impact of climate change. To download parts or all of the current report, please go to: http://ipcc-wg1.ucar.edu/wg1/wg1-report.html
Photographs from the World View of Global Warming are available for license to publications needing science photography, environmental groups and agencies, and other uses. Stock photography and assignments available.
Use of photographs in any manner, in part or whole, without permission is prohibited by US copyright law. These photographs are registered with the US Copyright Office and are not in the Public Domain.
![]()
COPYRIGHT NOTICE:
Photography and text Copyright © 2005 - 2017 (and before) Gary Braasch All rights reserved. Use of photographs in any manner without permission is prohibited by US copyright law. Photography is available for license to publications and other uses. Please contact requestinformation@worldviewofglobalwarming.org. View more of Gary Braasch's photography here.