


Paleoclimate/Ancient Temperatures
What caused the ice ages? How long have the tropics been tropical? What drove the Anasazi out of their cliff dwellings and into oblivion? To answer questions like this, scientists are curious about the past climate of the earth. Today, the speed at which greenhouse gases and temperature are changing has given urgency to studies of the past or paleoclimate. We not only want to see into previous eras, but also to have a basis to predict what is to come.
Before about the middle of the 19th Century, when thermometers became common scientific instruments, there are no direct records of the air or ocean temperature. Even today many locations on the planet are not regularly checked to see how warm, cold, dry or wet they are. So geophysicists have searched for ways to infer temperature and moisture levels by the effects they have had on bodies of water, glaciers and living things. There is intense study of ancient lake bottom mud (containing yearly layers of silt and pollen, etc), deep ocean sediments laid down tens of thousands of years ago (with the remains of tiny sea creatures affected by ocean conditions), glacier and ice cap cores (the oldest of which recovered ice deposited half a million years ago), yearly growth rings of trees and corals, and of course fossils of creatures who lived in different past climates.
Results of these investigations have given us understanding of the close relationship between atmospheric carbon dioxide levels and air temperature (Antarctic ice core records), the last thousand years of temperature (tree rings, lake sediments, etc.), and the reality of very rapid changes in temperature (the Greenland ice cap cores), to name some well known results. World View of Global Warming has documented some of this kind of research, beginning with ocean coring near disintegrating ice shelves in Antarctica
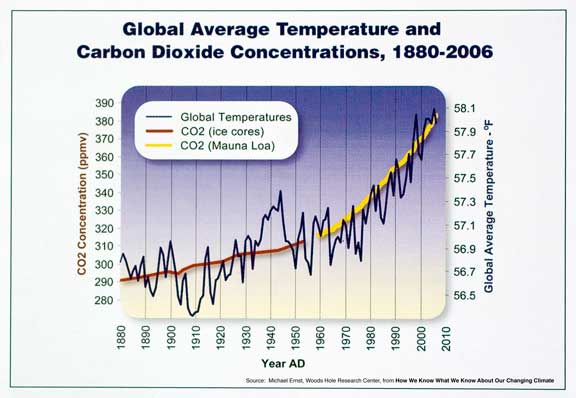
There is a tight correlation between the amount of CO2 and methane in the atmosphere and the average world air temperature. In general and over time, more carbon dioxide = higher temperature as the molecules absorb and re-radiate more heat. It is amazing but scientifically accepted and demonstrated that a few hundred molecules of CO2 per million total air molecules (ppm) -- and even fewer per million of other greenhouse gases -- can warm the air. But this is the main reason the Earth became warm enough to support life, and the process is still at work as we add more warming gases from fossil fuels and agricultural processes. This graph shows the measured record of temperature readings back through the mid 19th century, when thermometers were first in widespread use, superimposed on the rise of CO2 in that same period. Since 1956, the amount of the gas in the air has been directly measured at an observatory on Mauna Loa, Hawaii (and other places). The current amount (2008) 387 ppm and it is rising at about 2 ppm per year.
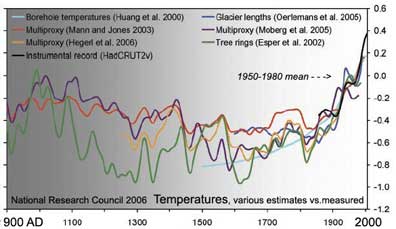
As is illustrated in the previous page on this website because carbon dioxide levels were relatively steady, around 280 parts per million, for many hundreds of years, the surface temperature of the Earth stayed in a narrow range. This chart shows the results of several ways of estimating past 900 years of temperatures, including tree rings and lake sediment layers (see below).
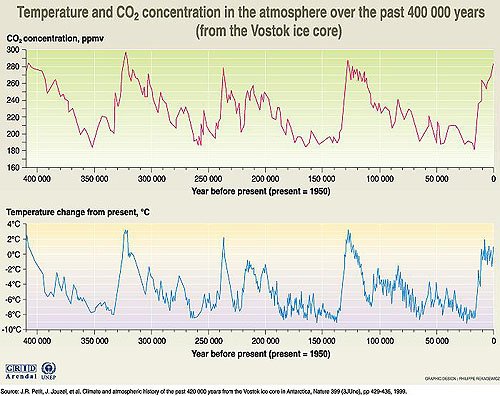
There is a tight correlation between the amount of CO2 and methane in the atmosphere and the average world air temperature. More carbon dioxide = higher temperature. Scientists investigating ancient rocks and ocean sediment can see the relationship going back millions of years. None of the correlations is as tight as that extracted from the deep ice core drilled into the Antarctic ice cap at the Russian Vostok base.
Measuring CO2 trapped in the ice and using oxygen isotopes as an indicator of temperatures, J. R. Petit and his co-workers were able to draw this double chart of 420,000 years. None of the CO2 levels they found is as high as we have today: "Present-day atmospheric burdens of these two important greenhouse gases seem to have been unprecedented during the past 420,000 years," they wrote in Nature.
Other studies suggest that today's 370 parts per million of CO2 is the greatest in 20 million years -- and it is still going up.
 Scientists investigating ancient rocks and ocean sediment can see the relationship going back millions of years. The correlations are especially tight as measured from deep ice cores drilled into the Antarctic ice cap at the Russian and French bases. Measuring CO2 trapped in the ice and using oxygen isotopes as an indicator of temperatures, J. R. Petit and his co-workers were able to draw this double chart of 420,000 years. None of the CO2 levels they found is as high as we have today: "Present-day atmospheric burdens of these two important greenhouse gases seem to have been unprecedented during the past 420,000 years," they wrote in Nature. Other ice cores have extended this relationship back beyond 800,000 years.
In these very pronounced ice age cycles, which include the last one that peaked about 25-30,000 years ago, slight changes in the Earth's orbit and tilt and the amount of warmth from the sun start the process of cooling. As the earth gets colder and some ice begins to accumulate in the Arctic, the white snow and ice reflects more sunlight away, increasing the cooling. When the great planetary cycles turn the other way, the earth including its oceans begins to warm and ice begins to melt. Warmer oceans absorb less CO2 and new ground revealed along the edges of the great ice sheets emit more CO2 and methane -- so the natural warming cycle is accelerated by increasing greenhouse gases. Scientists see that even though CO2 increases lag behind the change in earth cycles at these times, the powerful warming from the gases becomes the primary driver of the melting of the ice sheets and a return to the warmer period between the ice ages. This process takes thousands of years. This is where we are now --- in an inter glacial. The sun is relatively inactive and the great cooling cycles are just beginning again. But humans have put so much extra CO2 and methane into the air since the beginning of the Industrial Revolution that those gases are now by far the strongest influence on climate. And instead of thousands of years, the measurable rise of greenhouse gases has taken just a little over 250 years, rapidly increasing as population and industrialization have exploded in the 20th century.
 Other studies suggest that today's 370 parts per million of CO2 is the greatest in 20 million years -- and it is still going up.
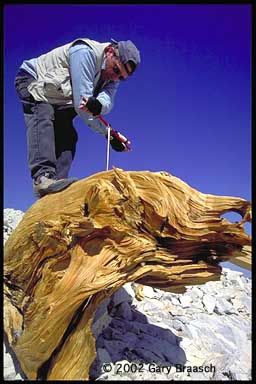
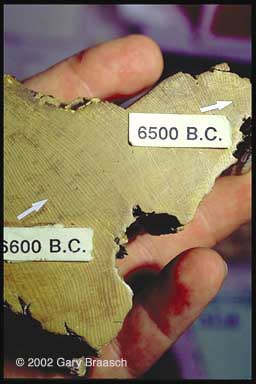
Estimates of more recent past temperatures are based largely on tree rings -- the mark of yearly growth of a tree that is extremely sensitive to local conditions and which over the years etches a chart of climate. Dr. Malcom Hughes of the University of Arizona dendrochronology lab is among a small group of scientists who have cored trees and made cross sections of dead stumps all over the world.
One tree that has been extremely important in reading deep into history is the bristlecone pine of the White Mountains, California, where Dr. Hughes and associates worked in 2002 to extract ring data from thousands of years old wood from pines that died many hundreds of years ago. The dry climate at nearly 12,000 feet preserves these old stumps and their record of climate going back 10,000 years. Other living things that react to environmental changes also can be read for clues to ancient temperature and growth conditions. Among the most commonly used are coral cores, which are similar to tree rings, and studied here by Kevin Helmle of the National Coral Reef Institute at Nova Southeast University, Dania Beach, Florida.
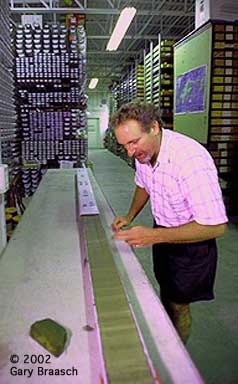
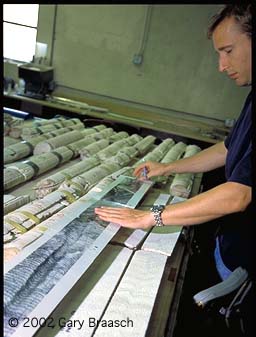 Each year sediment falls to the
bottom of oceans and lakes, and this record can be extracted by
inserting hollow tubes into the mud (See Antarctic Section, also).
Each year sediment falls to the
bottom of oceans and lakes, and this record can be extracted by
inserting hollow tubes into the mud (See Antarctic Section, also).
Sediment cores from both oceans surrounding North America have been studied by scientists like Lloyd Keigwin at Woods Hole Oceanographic Institute to make a picture of geologically recent climate events like the Little Ice Age.
The oldest climate records come from glaciers and ice caps, for which cores extend back almost half a million years (in Antarctica).
Photographs from the World View of Global Warming are available for license to publications needing science photography, environmental groups and agencies, and other uses. Stock photography and assignments available.
Please contact requestinformation@worldviewofglobalwarming.org or Gary Braasch Photography (503) 860-1228.
Use of photographs in any manner, in part or whole, without permission is prohibited by US copyright law. These photographs are registered with the US Copyright Office and are not in the Public Domain.
![]()