
National Climate Assessment
"Climate change is happening now... in every part of the United States." National Climate Assessment, most thorough review of how we're being affected, also says progressive change is beginning in how we make and use energy, but much, much more is needed.
The new report, the 2014 U.S. National Climate Assessment, is packed with facts, ideas, problems and solutions, and is a guide to how your area is already feeling climate disruption and what your neighbors and businesses are beginning to do about it. The report connects the U.S. -- less than 2 percent of the total area of the Earth, but directly causing more than 17 percent of greenhouse gas pollution -- with people in the rest of the world who are also already affected by climate disruption. Here, in photos from the Climate Change Image Library, are some of the Key Messages highlighted by the assessment.
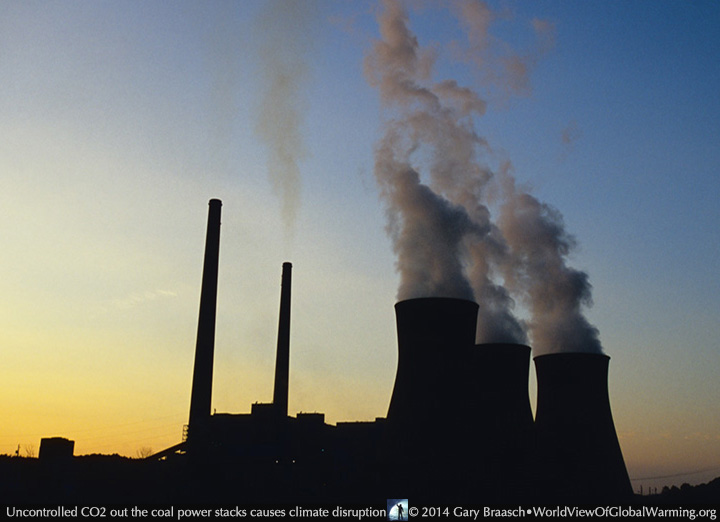
Global climate is changing and this change is apparent across a wide range of observations. The global warming of the past 50 years is primarily due to human activities.
U.S. average temperature has increased by 1.3°F to 1.9°F since record keeping began in 1895; most of this increase has occurred since about 1970. The most recent decade was the nation’s warmest on record. Temperatures in the United States are expected to continue to rise. Because human-induced warming is superimposed on a naturally varying climate, the temperature rise has not been, and will not be, uniform or smooth across the country or over time.
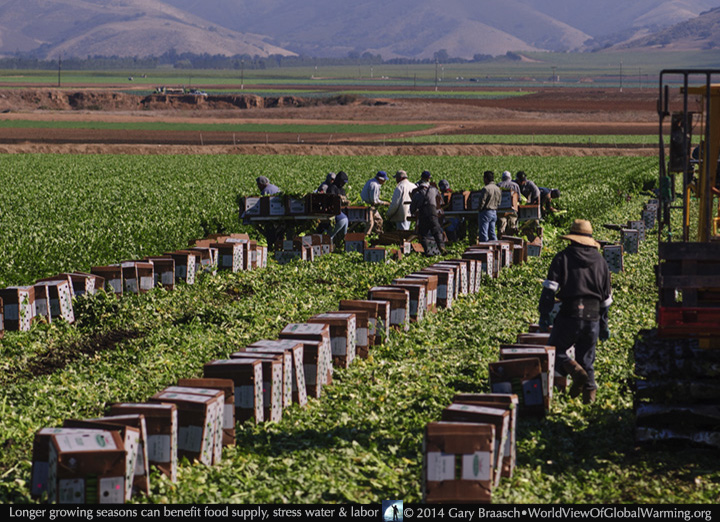
The length of the frost-free season (and the corresponding growing season) has been increasing nationally since the 1980s, with the largest increases occurring in the western United States, affecting ecosystems and agriculture. Across the United States, the growing season is projected to continue to lengthen.
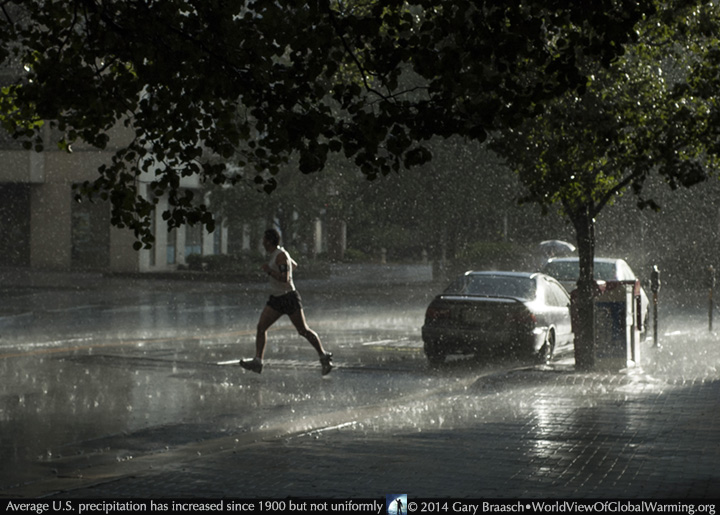
Average U.S. precipitation has increased since 1900, but some areas have had increases greater than the national average, and some areas have had decreases. More winter and spring precipitation is projected for the northern United States, and less for the Southwest, over this century.
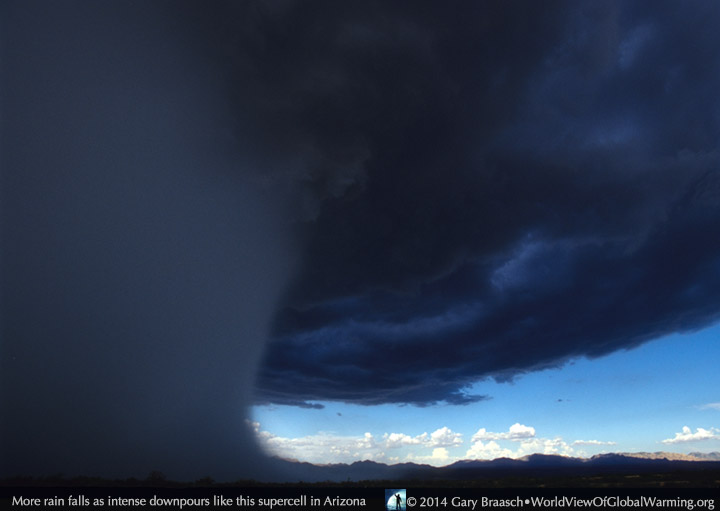
Heavy downpours are increasing nationally, especially over the last three to five decades. Largest increases are in the Midwest and Northeast. Increases in the frequency and intensity of extreme precipitation events are projected for all U.S. regions.
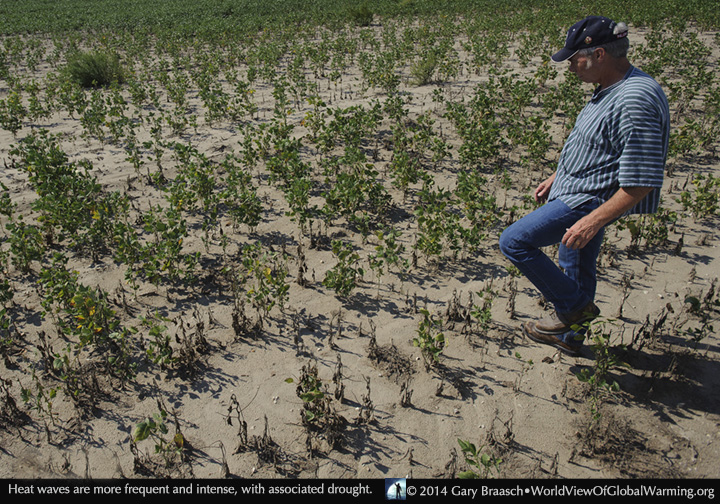
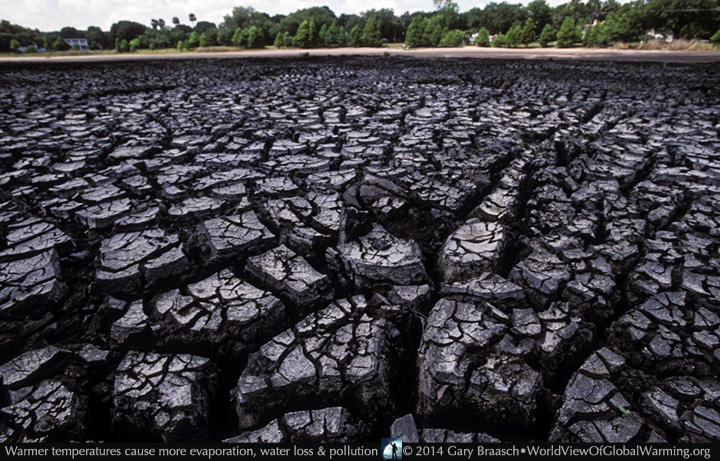
There have been changes in some types of extreme weather events over the last several decades. Heat waves have become more frequent and intense, especially in the West. Cold waves have become less frequent and intense across the nation. There have been regional trends in floods and droughts. Droughts in the Southwest and heat waves everywhere are projected to become more intense, and cold waves less intense everywhere.
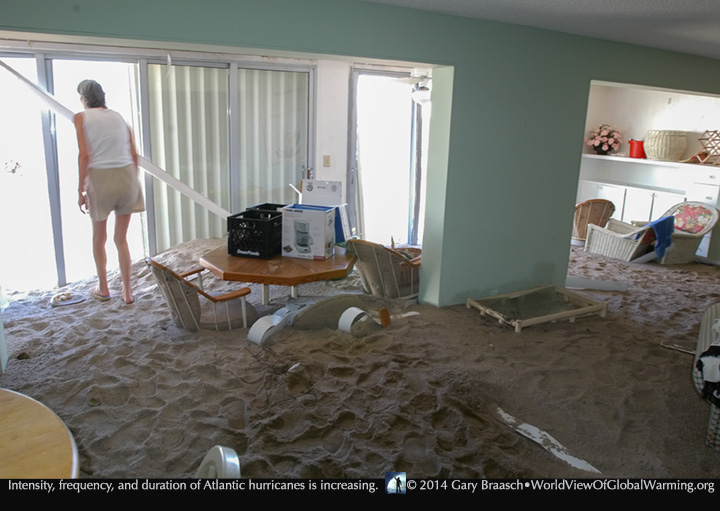
The intensity, frequency, and duration of North Atlantic hurricanes, as well as the frequency of the strongest (Category 4 and 5) hurricanes, have all increased since the early 1980s. The relative contributions of human and natural causes to these increases are still uncertain. Hurricane-associated storm intensity and rainfall rates are projected to increase as the climate continues to warm.
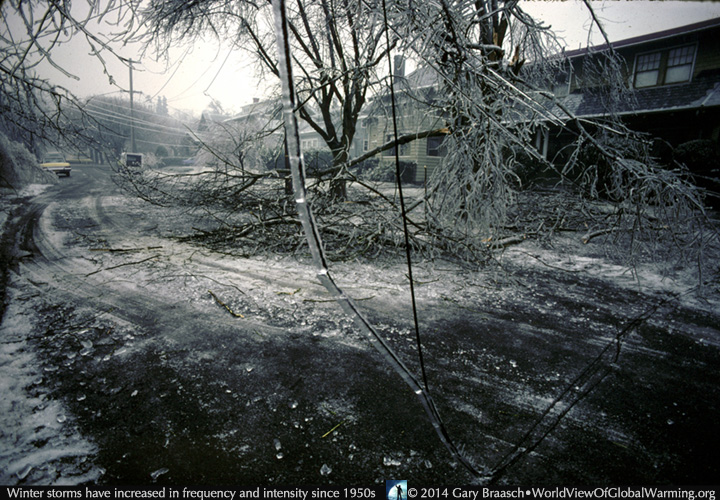
Winter storms have increased in frequency and intensity since the 1950s, and their tracks have shifted northward over the United States. Other trends in severe storms, including the intensity and frequency of tornadoes, hail, and damaging thunderstorm winds, are uncertain and are being studied intensively.
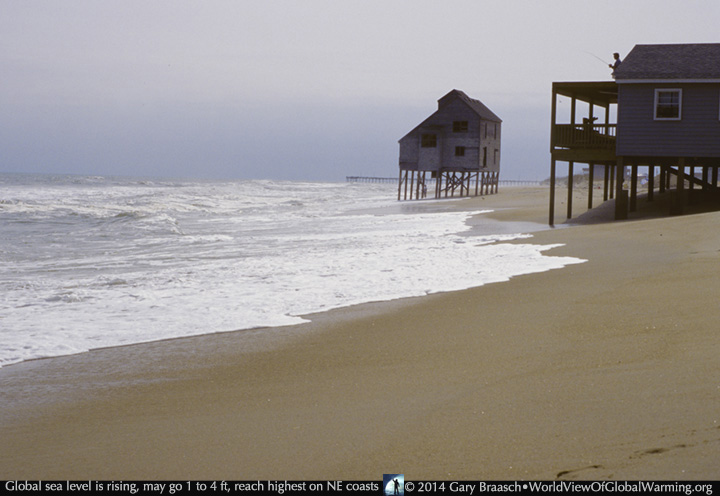
Global sea level has risen by about 8 inches since reliable record keeping began in 1880. It is projected to rise another 1 to 4 feet by 2100.
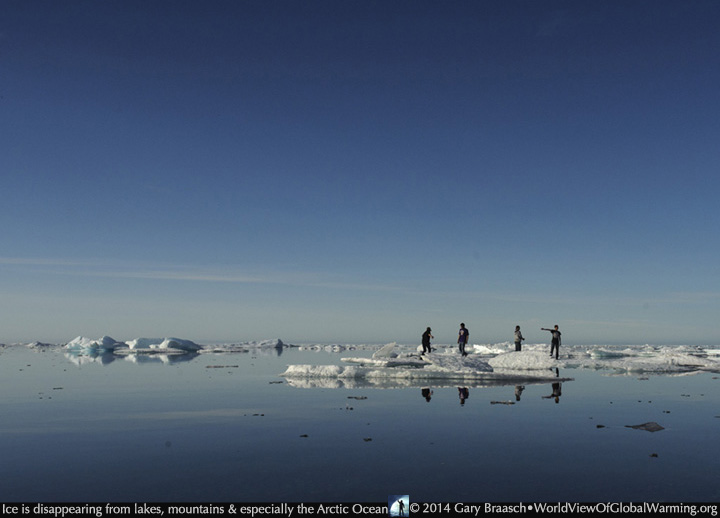
Rising temperatures are reducing ice volume and surface extent on land, lakes, and sea. This loss of ice is expected to continue. The Arctic Ocean is expected to become essentially ice free in summer before mid-century.
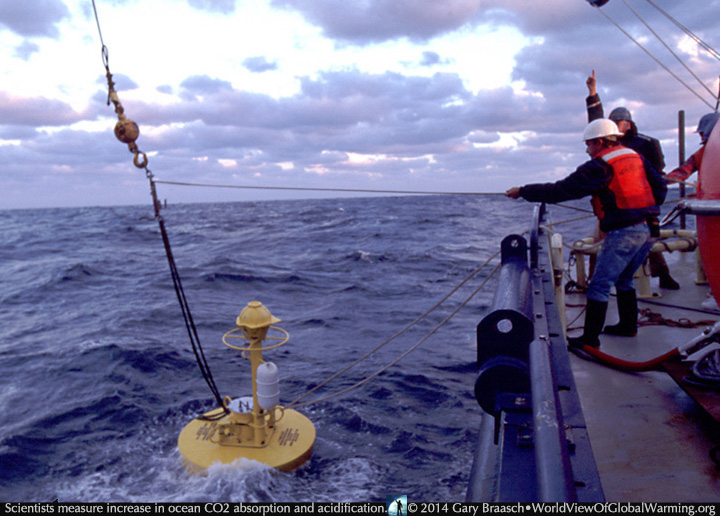
The oceans are currently absorbing about a quarter of the carbon dioxide emitted to the atmosphere annually and are becoming more acidic as a result, leading to concerns about intensifying impacts on marine ecosystems.
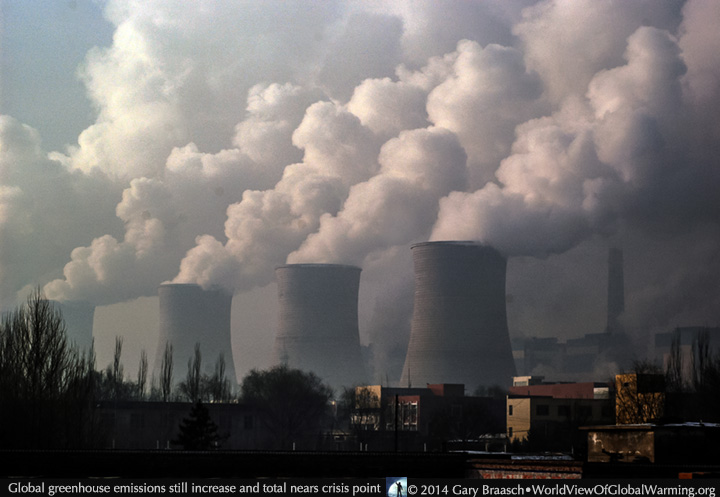
To meet the lower emissions scenario used in this assessment, global mitigation actions would need to limit global carbon dioxide emissions to a peak of around 44 billion tons per year within the next 25 years and decline thereafter. In 2011, global emissions were around 34 billion tons, and have been rising by about 0.9 billion tons per year for the past decade. Therefore, the world is on a path to exceed 44 billion tons per year within a decade.
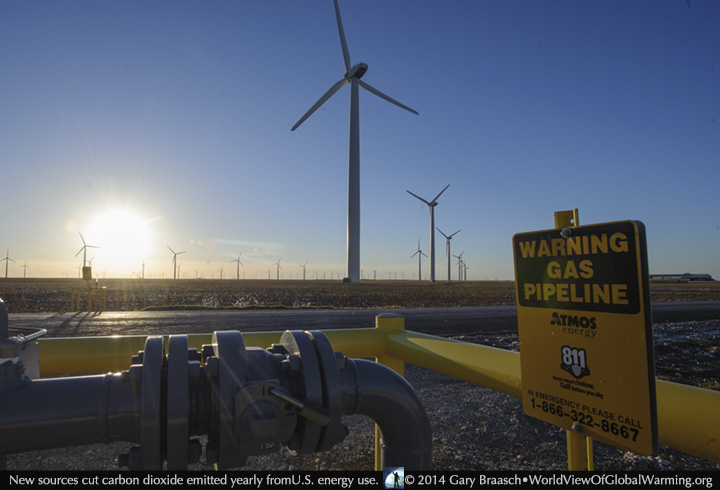
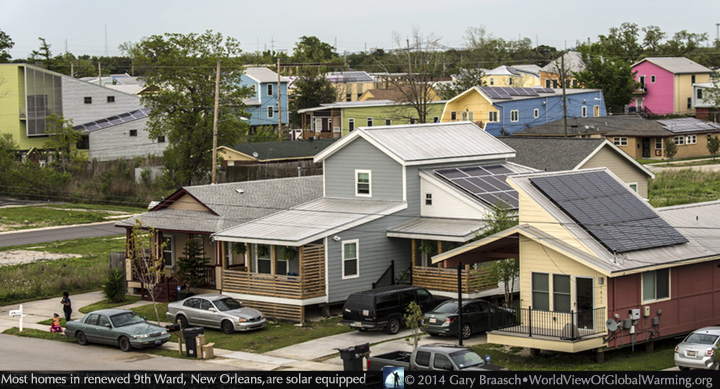
Over recent decades, the U.S. economy has emitted a decreasing amount of carbon dioxide per dollar of gross domestic product. Between 2008 and 2012, there was also a decline in the total amount of carbon dioxide emitted annually from energy use in the United States as a result of a variety of factors, including changes in the economy, the development of new energy production technologies, and various government policies.

Carbon storage in land ecosystems, especially forests, has offset around 17% of annual U.S. fossil fuel emissions of greenhouse gases over the past several decades, but this carbon “sink” may not be sustainable.
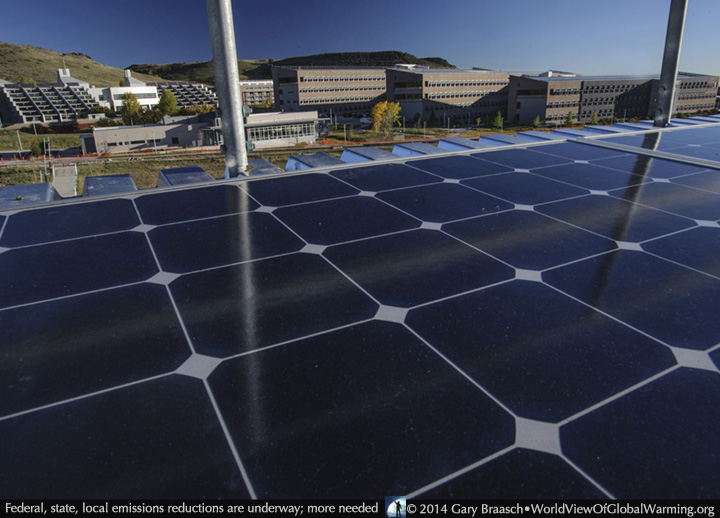
Both voluntary activities and a variety of policies and measures that lower emissions are currently in place at federal, state, and local levels in the United States, even though there is no comprehensive national climate legislation. Over the remainder of this century, aggressive and sustained greenhouse gas emission reductions by the United States and by other nations would be needed to reduce global emissions to a level consistent with the lower scenario analyzed in this assessment.
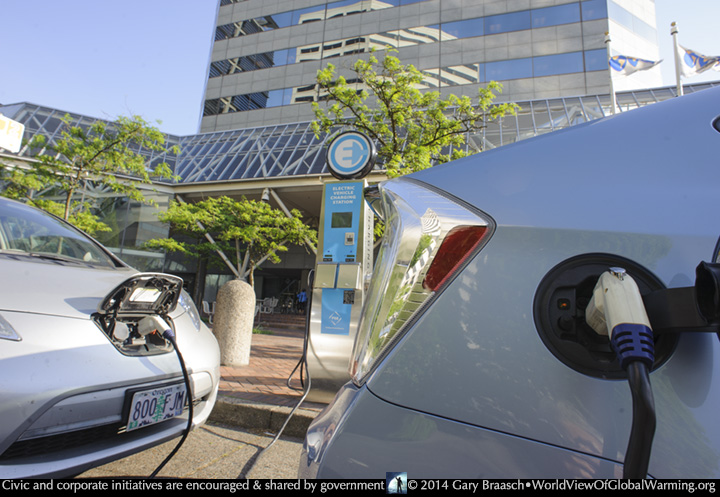
Substantial adaptation planning is occurring in the public and private sectors and at all levels of government; however, few measures have been implemented and those that have appear to be incremental changes.
Climate change adaptation actions often fulfill other societal goals, such as sustainable development, disaster risk reduction, or improvements in quality of life, and can therefore be incorporated into existing decision-making processes.
NOTE that the National Climate Assessment also has sub-findings for each of the main regions and areas from water to ecosystems to human health, all of which have been covered over the years in World View of Global Warming.
![]()
This project would be impossible without scientists and observers around the world who have provided hundreds of scientific contacts and papers. See Background, Advisors, and Reference for documentation, funders and major advisors, without whom I could not complete the work.
World View of Global Warming is a project of the Blue Earth Alliance, Seattle Washington, a 501(c)3 tax-exempt organization. The project is supported entirely by donations, grants, and license fees for the photographs. Please see information about how to contribute.
For other information about Gary Braasch's climate change projects and books, please see the books Earth Under Fire and How We Know What We Know About Our Changing Climate, and the exhibit "Climate Change in Our World" at the Books and Exhibits link.
COPYRIGHT NOTICE:
Photography and text Copyright © 2005 - 2017 (and before) Gary Braasch All rights reserved. Use of photographs in any manner without permission is prohibited by US copyright law. Photography is available for license to publications and other uses. Please contact requestinformation@worldviewofglobalwarming.org. View more of Gary Braasch's photography here.