
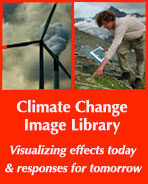
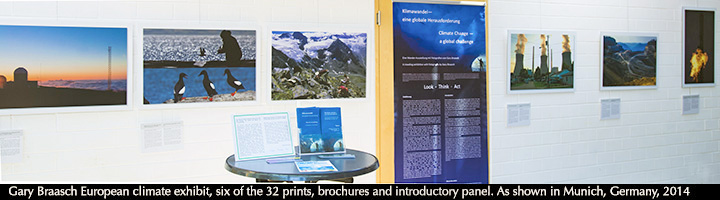
Climate Change in Our World II, exhibited in Munich and Brussels, 2014, and traveling in Europe, 2015
A new version of Gary Braasch's color print exhibition "Climate Change in Our World," curated and mounted for display throughout Europe, opened 16 September at the Ecological Education Centre, Munich Germany. Curated and organized by Maiken Winter, founder of the NGO WissenLeben, the exhibit of large prints is supported and funded by the U.S. Consulate General in Munich, KIS GmbH software, TUM University School of Education, Meteodata and the insurance company Gothaer. We are grateful also to the printer, ALOE GmbH and for the collaboration of the Rachel Carson Center in Munich. After winter public exhibition at the Munich Botanical Garden, it is now traveling to schools and city venues in Germany.For information and bookings throughout Europe, please contact Maiken Winter.

The exhibition was next displayed at the opening ceremony of a Belgian government Climate Science Education centre and 50 year celebration of climate science in Brussels. More than 8000 people saw the show during the weekend opening October 10-14. Next public show for these prints is a display through the winter inside the Munich Botanical Garden.
Locations of the photographs include the Arctic, high mountain regions such as the Himalayas and the Alps, Peru, North America, China, Kenya, Australia and Antarctica. Images were updated for the show, including new repeat photography of glaciers in the Andes and Alps. The captions are detailed descriptions connecting the science, effects and solutions to local issues -- in Germany an emphasis is on the national renewable energy initiative. Captions were displayed in English, German, French and/or Dutch by the curators of the various venues. For the Munich show, Dr. Ricarda Winkelmann, scientist at Potsdam Institute for Climate Impact Research, was scientific advisor. All photography and text copyright © 2014 Gary Braasch.
Designed for public venues, the 120 cm (46 inch) prints may also be shown at education centers and agencies. We seek venues throughout Europe. Please contact WissenLeben or this website.
Part 1, prints 1-16. Part 2, prints 17-32.
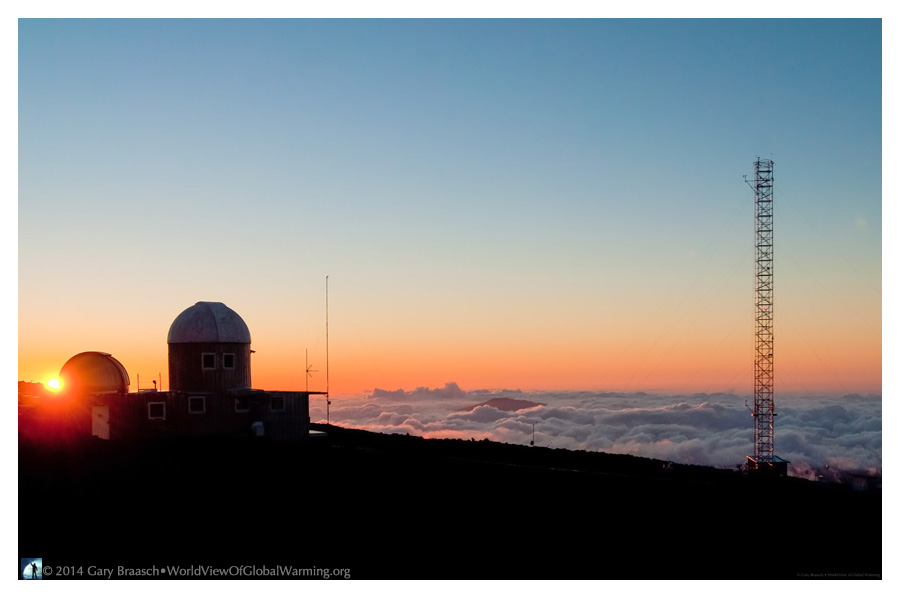
Carbon dioxide levels reach 400 ppm for first time in millions of years. Direct measurements are made on Hawaii’s Mauna Loa.
Global concentration of CO2 in the air -- the primary cause of global warming -- has been increasing due to human emissions 10 times faster than any natural change seen in the geologic record. In May 2013 it reached a daily average of 400 parts per million (ppm) as measured by the Scripps Institution of Oceanography and the U. S. agency NOAA at the tower (right) on Mauna Loa volcano, Hawaii. This year, the reading was above 400 ppm from April through July.
This is probably the highest amount since the Pliocene epoch, three to five million years ago. During that ancient time, as carbon dioxide was gradually decreasing from the dinosaur age (65 million years ago), the geologic record indicates that temperature was three or four degrees higher than today’s and sea level ranged between five and 40 meters higher.
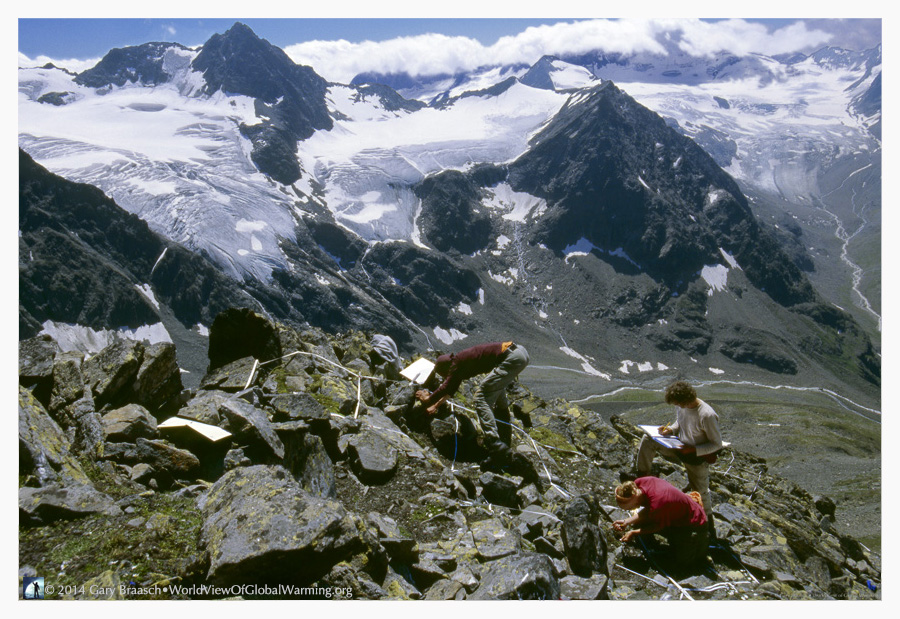
Alpine botanists tracking ecosystem shifts. Scientists count and measure plants high in the Austrian Alps.
Research on mountains like Shrankogel, Austria, shows that regional warming of 20 C is causing cold-adapted wildflowers and grasses to grow higher on the mountainsides. The tops of mountains have less surface area and less soil, so as plants try to grow in cooler, higher elevations, they often do not find suitable habitat.
Thus, alpine ecosystems are being disrupted as climate change intensifies. Life zones and ecological systems are being fragmented and rearranged. Worldwide, the habitats of many individual plant and animal species have shifted almost 17 km towards the poles or 11 meters upslope per decade. Spring events like blooming are occurring earlier by 2.3 days per decade, even earlier in some places.
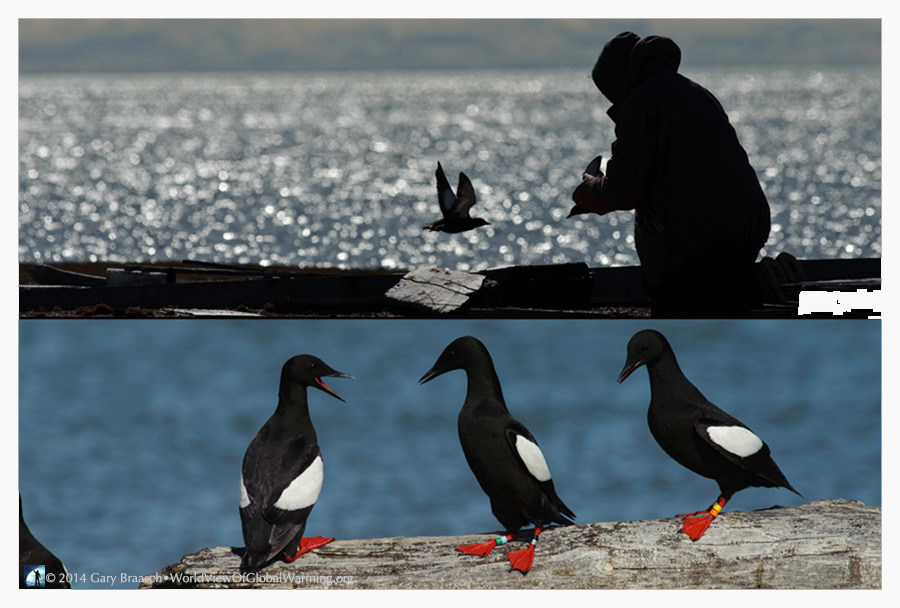
Arctic bird research reveals effects of loss of polar sea ice. Offshore of Barrow, Alaska, a solitary scientist studies black guillemots.
Biologist George Divoky has been tracking the life cycle of the black guillimot seabird on an island in the Arctic Ocean, Alaska, for more than 40 years. During this time, sea ice extent has plummeted, with a record low reached after the summer melt in 2012. Divoky documented the birds’ increasing challenge of finding adequate food, Arctic cod that lives under the sea ice, as ice retreats more than 300 miles from the rookeries.
This sea ice loss also means severe change in polar bear, walrus, and caribou habitats; damaging erosion along shorelines; increased precipitation and river flow; and increasingly open passage for ships. The warming Arctic Ocean and shrinking amount of sunlight reflectance from the ice in summer are major factors in Northern hemisphere weather and global climate
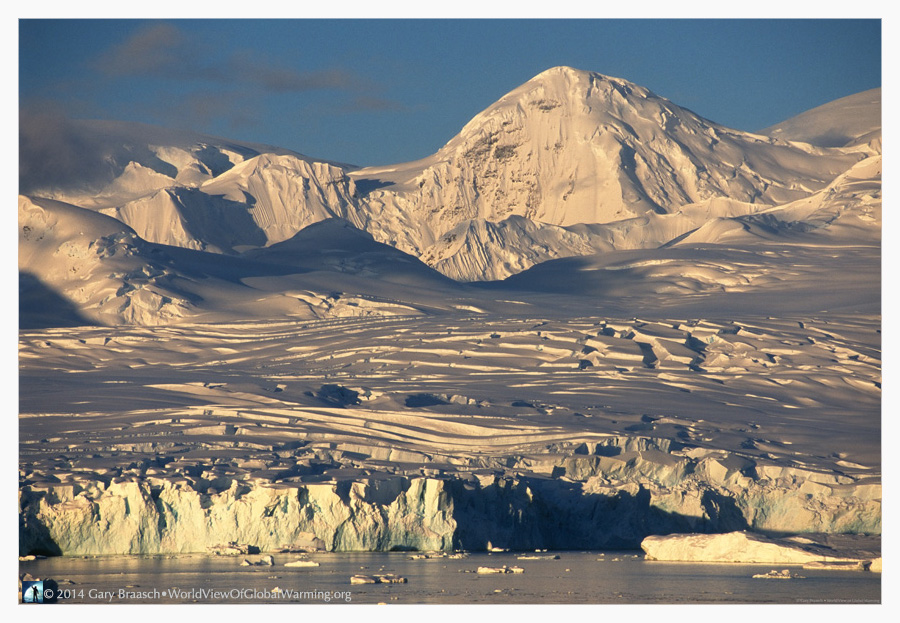
Glaciers reveal changes in Antarctica. Pristine-looking ice nevertheless is changing around the South Pole.
Hundreds of glaciers on the Antarctic Peninsula are flowing faster and calving in response to warming temperatures, often revealing rocky shorelines which had been under thick ice. Recent breakup of floating ice shelves which extend like skirts out from the rocky edge of the continent releases ice from the glaciers behind them. The glaciers begin flowing up to eight times faster, dumping ice into the ocean to raise sea level.
Farther south in Antarctica, glaciologists are concerned that an “irreversible” loss of glacier ice has been set in motion for five Amundsen Sea glaciers. Loss of glaciers in this area will eventually cause about a 2 meter sea level rise over hundreds of years.
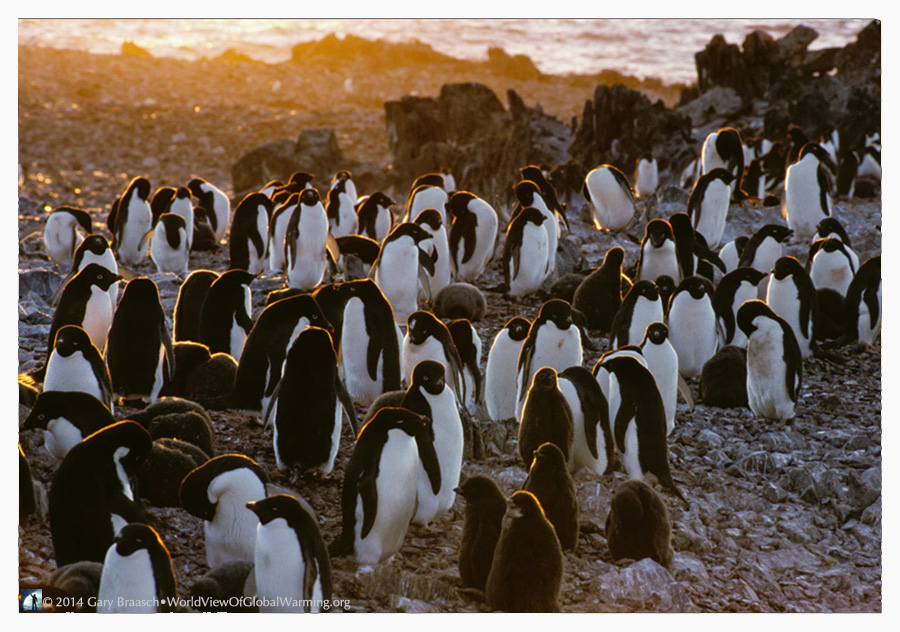
Penguins, sensitive monitors of ice and the ocean. A rookery of Adelie penguins affected by sea ice changes over 35 years.
Adelie penguins (Pygoscelis adeliae) preen on a rookery near Anvers Island, Antarctica, where thousands of the birds have nested for at least 600 years. Over the last 35 years this island has lost half of its 8,000 nesting pairs, as monitored by ornithologist Bill Fraser. Winter temperatures in this peninsula region are almost 6.50 C warmer than 50 years ago.
Winter sea ice, although sometimes increasing in area, does not freeze as thickly as before and melts away faster in summer. Beneath the ice is habitat for krill, penguins’ main food. When summer ice decreases, the birds must swim farther, they get less prey, and chicks suffer. The well-studied emperor penguins of Terre Adélie (of “March of the Penguins” fame) are also affected. Farther south in Antarctica, receding glaciers have opened new habitat for other penguins.
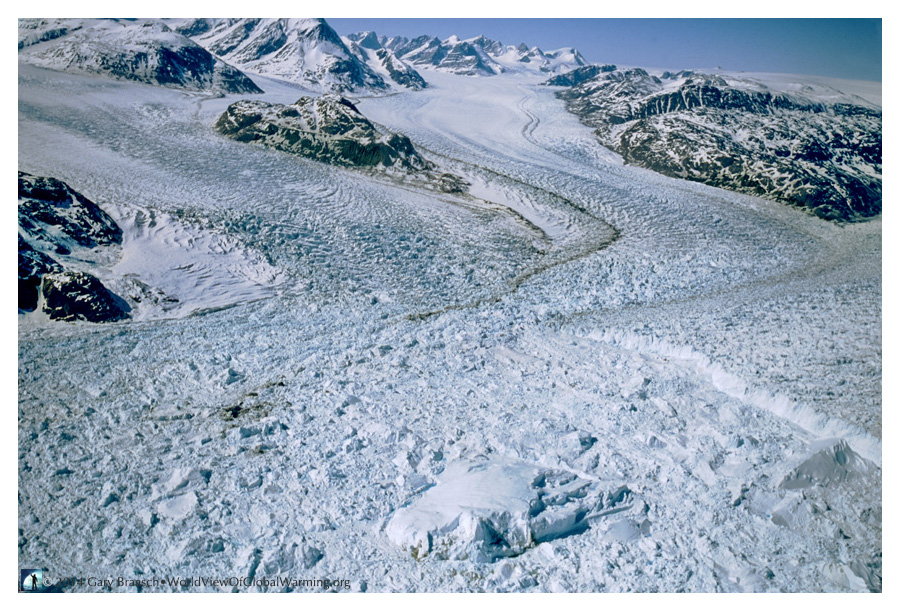
Melting ice cap and fast-flowing glaciers in Greenland. Outlet glaciers react to higher temperatures and portend rising seas.
The Kangerdlugssuaq Glacier, the largest ice stream on Greenland’s isolated east coast, sweeps down from the ice cap and forms a heavily crevassed ice stream and calving front more than six km wide. Like other outlet glaciers being monitored by scientists, the glacier's movement has abruptly sped up in recent years, reaching 14 km per year, or more than 1.5 meters per hour, which is twice its previous flow. Changes in its flow appear tied to air and ocean water temperature.
Multiple records of ice change were set during summer 2012 in Greenland. Ninety-seven percent of the entire ice cap surface showed melting, the thaw lasted two months longer than the long-term average and Greenland lost glacier mass at almost twice the 2002-2006 rate. In 2013 the ice melt and loss were near average levels.
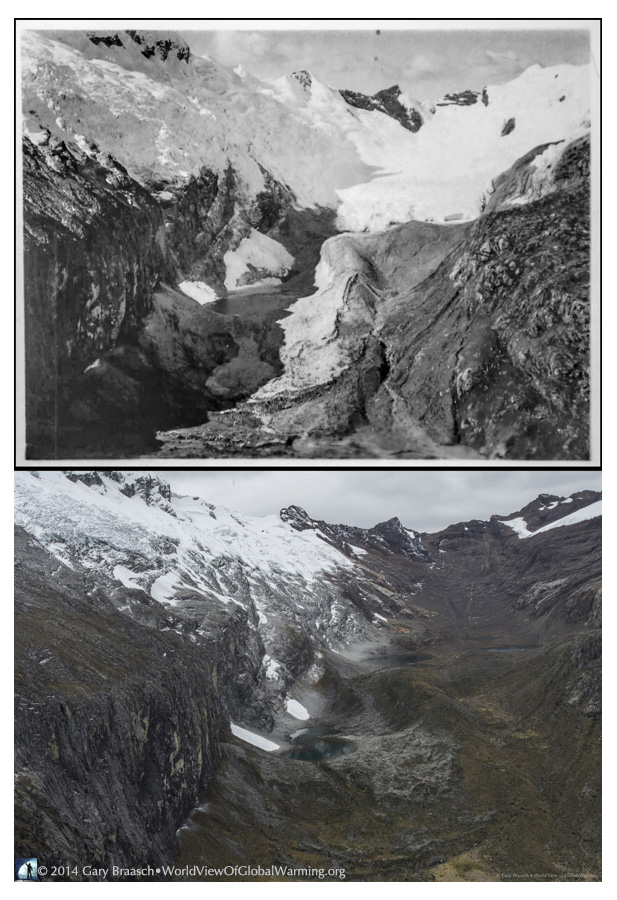
An Andes glacier completely disappears. One of the first direct views of the loss of a glacier: Glacier Broggi in 1932 (top) and now melted away.
In 1999, at the beginning of his project World View of Global Warming, photojournalist Gary Braasch made a repeat photo of Broggi Glacier in the Peruvian Andes, finding that the glacier had receded about a kilometer in sixty-six years. Fifteen years later, in summer 2014, Braasch again trekked up to 4600 m to photograph the Broggi Glacier – but now the glacier is completely gone.
Glaciologists think hundreds of glaciers may have disappeared since the Little Ice Age, but it is rare to have a direct record of one completely melted away. Glacier loss in the equatorial Andes is accelerating, cutting off up to sixty percent of the water flowing down valley – a loss to Peru’s rivers and the people, farms and hydroelectric uses below.
1932 photo by Hans Kinzl, courtesy Prof Georg Kaser, Institute of Geography, University of Innsbruck, and Dr. Alcides Ames, Huaraz, Peru
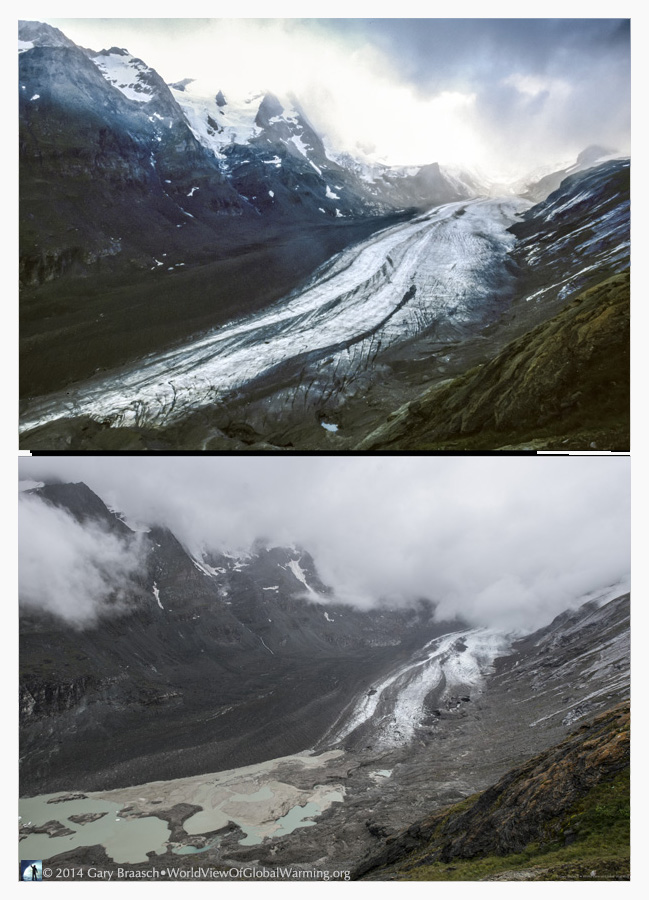
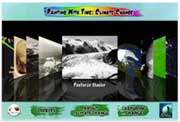
Large glaciers in the Alps continue rapid retreat. Pasterze Glacier, largest in Austria, shrinks more than 100 m in only a decade.
Flowing for 7 km beneath Austria's highest peak, Grossglockner (3798 m), the Pasterze Glacier shows a dramatic change in just ten years, August 2004 to August 2014. The long tongue of the ice is now replaced by silt and glacier water lakes. This glacier has been studied since 1864. Since 1880 it has lost more than half its volume of ice and is more than 2000 m shorter. In some years the Pasterze shrinks more than 18 meters.
The European Environment Agency reported in 2013 that "Glaciers in the European Alps have lost approximately two thirds of their volume since 1850, with clear acceleration since the 1980s." Freshwater supply and run off, river navigation, irrigation and power generation are being affected in various places.
There are more than 170,000 mountain glaciers in forty-one nations—one third of them are on the Himalayan-Tibetan plateau alone. In every mountain range, this ancient ice is withering away under assault from rising temperatures. Half the human population drinks water that originates in mountains.
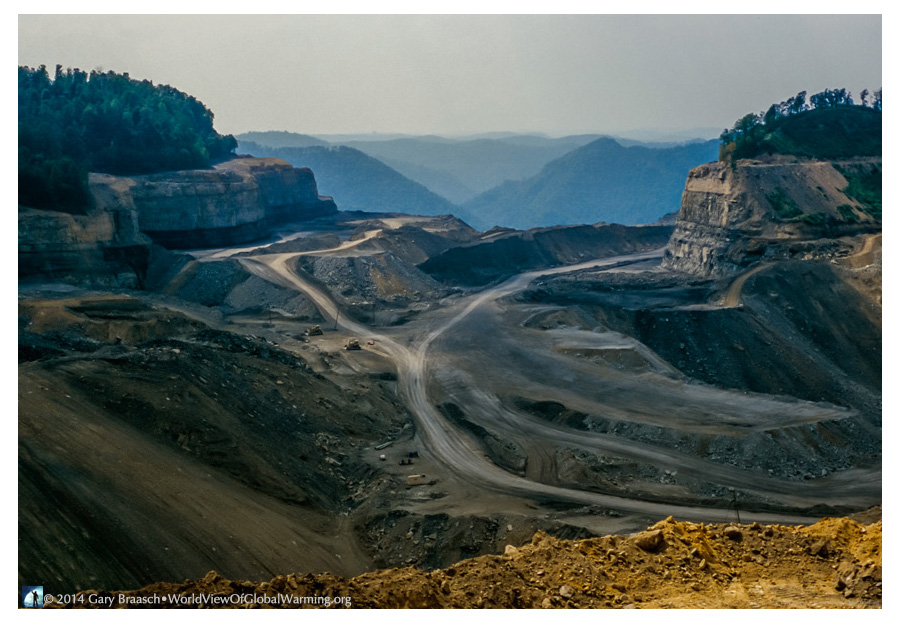
Mountaintop-removal coal mining destroys Appalachian Mountains. Coal companies blast away forested hills, devastate communities.
Much of the world’s coal is mined in open pit and strip mines, and a particularly harsh kind is “mountaintop removal” in the Appalachian Mountains of the United States. Coal from this region is exported mainly to China and Europe. Ancient forested mountains are blasted and ripped open by giant machines to get at coal seams, in the name of lower costs for the industry.
Mountaintop removal has occurred on about 500 sites in Kentucky, Virginia, Tennessee and here, in West Virginia, completely altering 566,000 Ha of land, obliterating more than 3000 km of streams and polluting even more. Nearby communities suffer as mine employment drops due to mechanization, mudslides and heavy vibrations destroy buildings, dust covers crops, air pollution chokes lungs and cancer and illness rates increase. This type of mining still continues although air and water pollution law enforcement is increasing in this region.
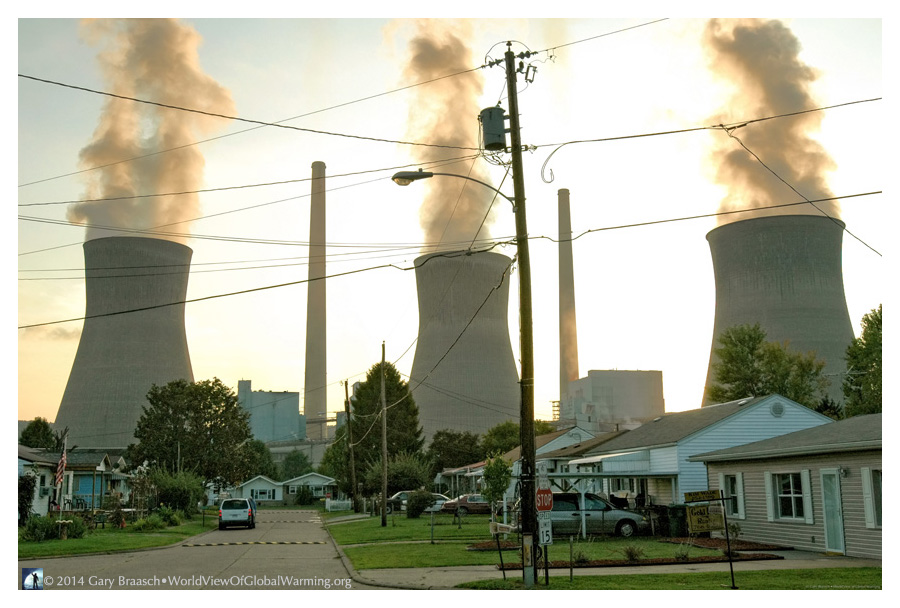
Coal looms across the world with pollution and disease. Pollutants streaming from tall smokestacks near Poca, West Virginia.
Cooling towers of the 2,900 megawatt Amos coal-fired power plant near Charleston, West Virginia, loom over a neighborhood. Steam from the towers is benign compared to the harmful coal smoke from the tall thin stacks. Coal smoke contains not only CO2, but nitrogen oxide, sulfur dioxide, and particulate and mercury pollution, killing 24,000 to 30,000 Americans each year, more than 22,000 in Europe, and many times more in China.
Yet the world uses coal to generate about 40 percent of its electricity. Entire ecosystems are devastated by strip mining and poisonous coal ash. Plants heat and pollute much more water than that used for residential purposes. In some areas switching to natural gas as a power-generating fuel is possible, but gas is also a carbon dioxide source, and involves other environmental concerns such as fracking and methane leaks.
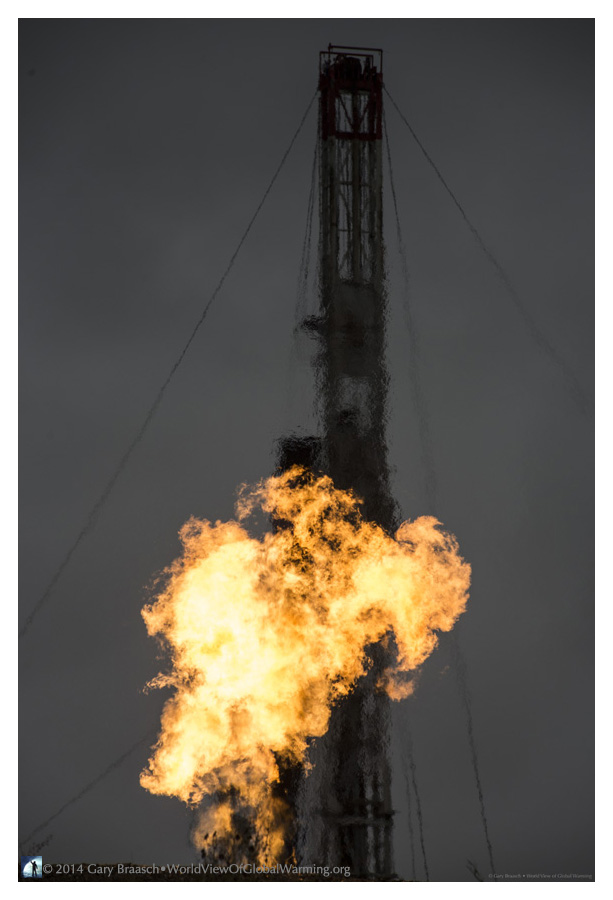
Fracking sets off eruption of gas and oil supply – and health and safety concerns. Issue flares into political controversy not only in the U.S. and Europe.
A rush of natural gas is aflame at one of the 10,000 new oil wells in North Dakota, a major place in the American West where directional drilling and hydraulic fracturing – fracking – has driven a resurgence of U.S. oil and gas supplies. But the technique of injecting chemical-laced water into wells has caused drinking water contamination, heavy use of ground water and increased soil and air pollution.
This oil rush, involving international oil firms, runaway population growth, infrastructure shortcomings and disruption of what had been mostly empty agricultural country, has created major social, labor, environmental and financial change. Some communities have voted to ban fracking and severely control water use and contamination. Fracking is now an issue in Europe, where France and Bavaria have banned the technique.
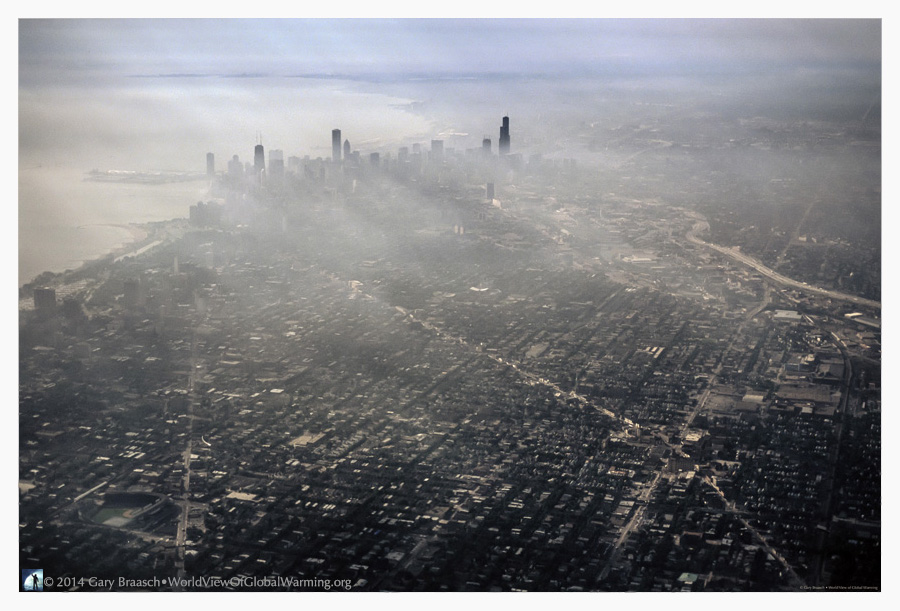
Heat waves cloud the future of cities. Chicago during the heat wave of July 1995.
Severe heat and air pollution choked the city of Chicago in July 1995, killing 875 people. This was just a foretaste of the heat wave of August 2003 in Europe, the hottest on record in the northern hemisphere. Temperature readings in many places reached well over 38°C day after day. Across ten heat-struck European nations, the estimated heat death toll was at least 70,000. Scientific research indicates these extremes of weather are made more likely by increased greenhouse gases in the atmosphere.
Worldwide, as many as 400,000 people die each year from direct effects of climate change on food and water access, infectious and chronic disease, and storm severity. Almost all of the mortality occurs in developing countries, which, according to UN data, probably contribute less than one percent of the world’s total greenhouse emissions.
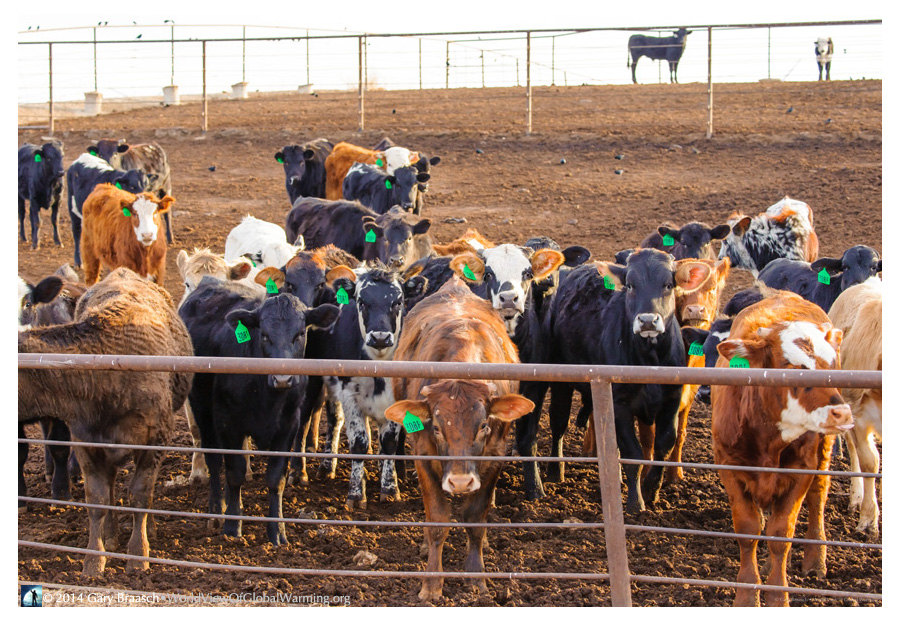
Agriculture’s heavy footprint on the land and the climate. Farming and cattle are leading sources of greenhouse gases.
Growing and producing food creates more than one-fifth of total world greenhouse emissions, according to the Food and Agriculture Organization (FAO). Most agricultural land is given over to livestock production including growing feed, grazing and food processing, contributing almost 15 percent of total world emissions, more than that generated by the world’s road vehicles. Much of this output is in methane and nitrous oxide, both more powerful greenhouse gases than CO2.
A recent study showed that beef production requires 160 times more land and produces 11 times more greenhouse gases than producing the equivalent calories in potatoes, rice and wheat. Rice paddies, also, are a significant source of methane. The FAO said that adopting better agricultural practices could sharply reduce the emissions from growing and processing food.
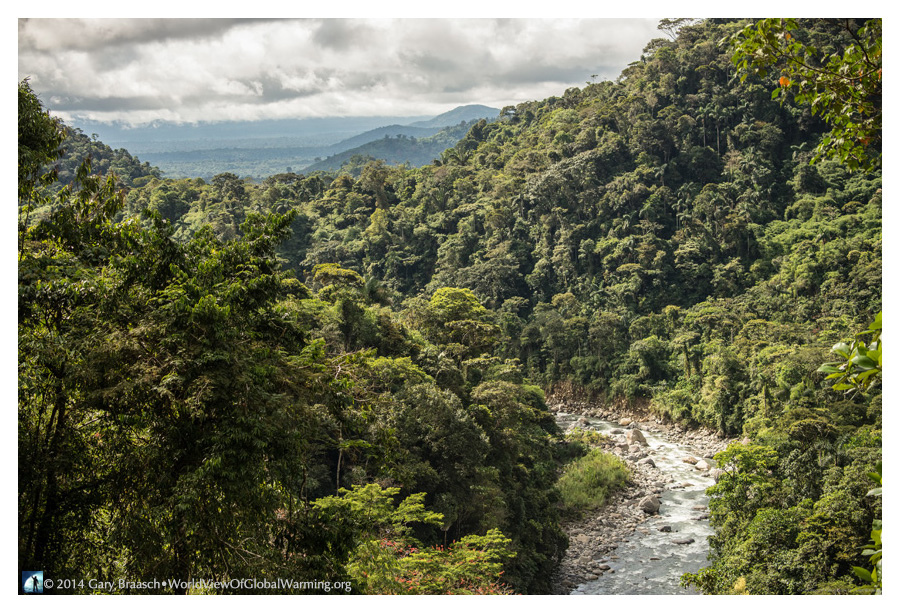
Tropical forests, rich reservoirs of biodiversity, are changing. In Peru’s Amazon, trees are migrating upslope as temperature rises.
The upper Amazon Basin of Peru stretches out below the tropical highlands of the Rio Cosnipata, in Manu National Park, a region in South America where there are more species of trees on a hectare than there are in all of North America. Even protected rainforests are at risk from extreme temperature increases. A study here shows some trees are moving upslope to cooler habitats at an average rate of 2.5 to 3.5 m per year -- seeds being successful upslope while old trees die out below – but the rate of change needed to match climate change is about 6 meters a year.
This forest is one of the deepest reservoirs of sequestered carbon in trees and soil on our planet. The rich benefits from tropical forests are just a few of crucial Earth “ecosystem services” being lost at a cost of more than US$4 trillion each year worldwide.
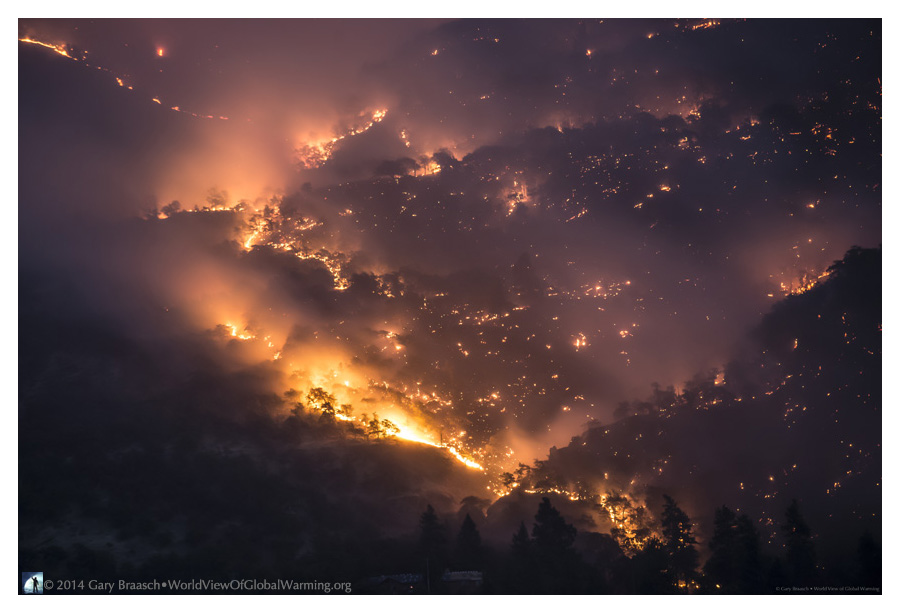
Wildfire ignites huge areas of the globe. Drought, heat, storminess from climate change fuel the increase in conflagrations.
Wildfire spreads down across a landscape of oak, fir and pine near Portland, Oregon, threatening a small town below. Fire is a crucial part of many forests’ ecology, but large destructive wildfires are increasing in size and frequency. Record infernos have occurred in Australia and New Zealand, Southern Europe, Russia, Indonesia, Texas and the North American West. U.S. research shows that in recent years large forest wildfires ignite nearly four times more often than in the past, while the total area burned is six times greater.
Humans are often the cause of fires but climate change fuels the trend: Drought is spreading, snowpack is decreasing and hot summers start earlier. Lightning storms and wind speed are increasing, and insect attacks are on the rise due to warmer winters. A vicious cycle is set in motion due to negative climate effects of smoke and soot and loss of living forests which absorb and store carbon.
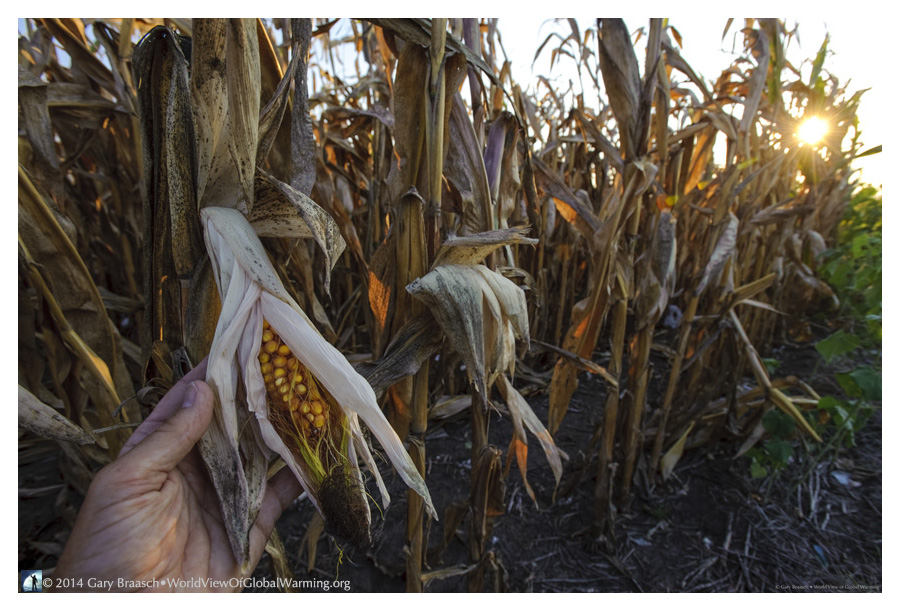
Drought strikes increasing areas, reducing food supply. The great American droughts follow intensifying pattern seen worldwide.
The great American drought of 2012 was the most intense in national weather records and the most extensive since the 1950's. The nation’s corn crop was reduced by 13 percent. It was one in a series of serious droughts which have dried up much of the U. S. Midwest, Texas, Southwest and California in recent years.
Natural drought cycles and seasons appear to be getting worse on all continents as demand expands heavy water use by agriculture and growing human populations. Studies by Aiguo Dai, an atmospheric scientist in the U.S. National Center for Atmospheric Research, indicate that "recent warming has increased atmospheric moisture demand and likely altered atmospheric circulation patterns." This is especially the case in parts of China and Africa, affecting water availability, rainfall patterns needed for agriculture, and therefore food security and risk of conflict.
![]()
This project would be impossible without scientists and observers around the world who have provided hundreds of scientific contacts and papers. See Background, Advisors, and Reference for documentation, funders and major advisors, without whom I could not complete the work.
World View of Global Warming is a project of the Blue Earth Alliance, Seattle Washington, a 501(c)3 tax-exempt organization. The project is supported entirely by donations, grants, and license fees for the photographs. Please see information about how to contribute.
For other information about Gary Braasch's climate change projects and books, please see the books Earth Under Fire and How We Know What We Know About Our Changing Climate, and the exhibit "Climate Change in Our World" at the Books and Exhibits link on the top menu of this page.
COPYRIGHT NOTICE:
Photography and text Copyright © 2005 - 2017 (and before) Gary Braasch All rights reserved. Use of photographs in any manner without permission is prohibited by US copyright law. Photography is available for license to publications and other uses. Please contact requestinformation@worldviewofglobalwarming.org. View more of Gary Braasch's photography here.